
Digital Route-To-Market
FMCG CEOs: Bridging The $5bn Ecommerce Gap On CHC & Launching FF&A Ecom IQ Index® & Ecommerce 3.0®

Author | Managing Director & Partner @ FFA
'See reality as it is, not as you wish it to be' - Jack Welch
To join the ~41,000 FMCG executives that receive automatically all our FMCG CEOs Insights (publications like this one), sign-up to our newsletter at the following link: FMCG CEOs: Managing For Growth
Time has come to stop the BS about Ecommerce indexes & rankings. There are too many out there (BCG, McK, Gartner L2, DCI, Flywheel, Profitero...) focusing on declarative, superficial, piecemeal and at such non-predictive metrics.
We stopped counting the celebratory trackers making everyone feeling good whereas most FMCG companies are bleeding market share online. To the point that it has often become the #1 driver of their omnichannel market share decline.
We are now introducing FF&A E-Commerce IQ® & E-Commerce 3.0® — the only holistic approach that diagnoses, prices & predicts e-commerce performance
• Existing e-commerce indexes stop at symptoms — self-reported maturity surveys or digital shelf hygiene scorecards; none financially anchored, none predictive of online market share
• FF&A E-Commerce IQ prices the gap between online and offline market share
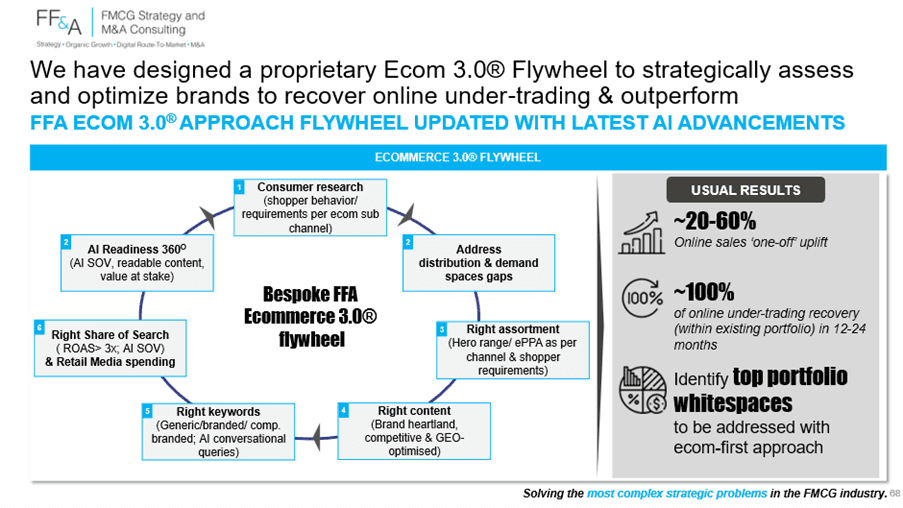
• FF&A E-Commerce 3.0® flywheel translates diagnosis into action — acting on all 6 drivers of online performance, now AI-enabled
• Proven engagement track record with the world largest FMCG companies — ~20–60% online sales uplift & ~100% under-trading recovery in 12–24 months
We are now initiating our FF&A Ecom IQ Index® coverage on the Consumer Health Care (CHC) vertical. Beauty Personal Care (BPC) and Pet Care will follow in the next weeks.
Over the last decade & especially since COVID-19, e-commerce has become a must-win battle across all FMCG verticals — and Consumer Healthcare (CHC) is no exception. Unprecedented resources were poured into digital teams, retail media, and sometimes large acquisitions, enabling most CHC players to approach their online 'fair share'.
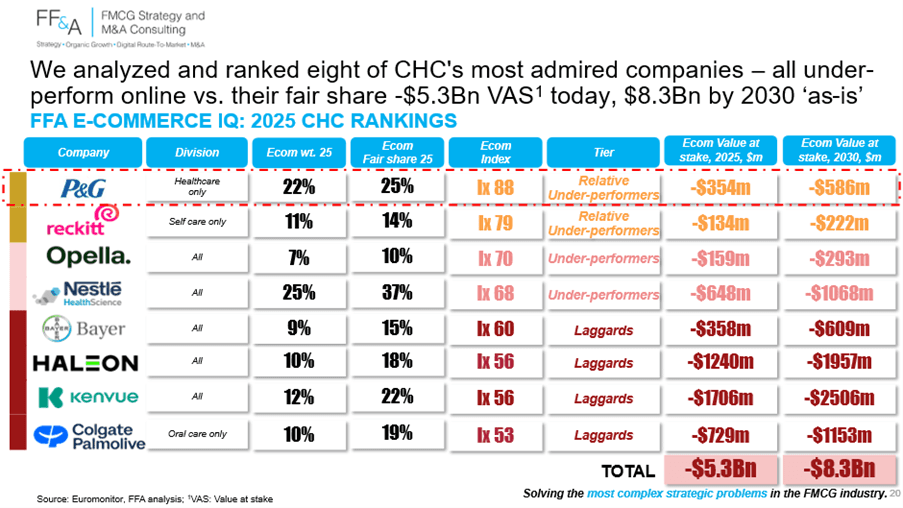
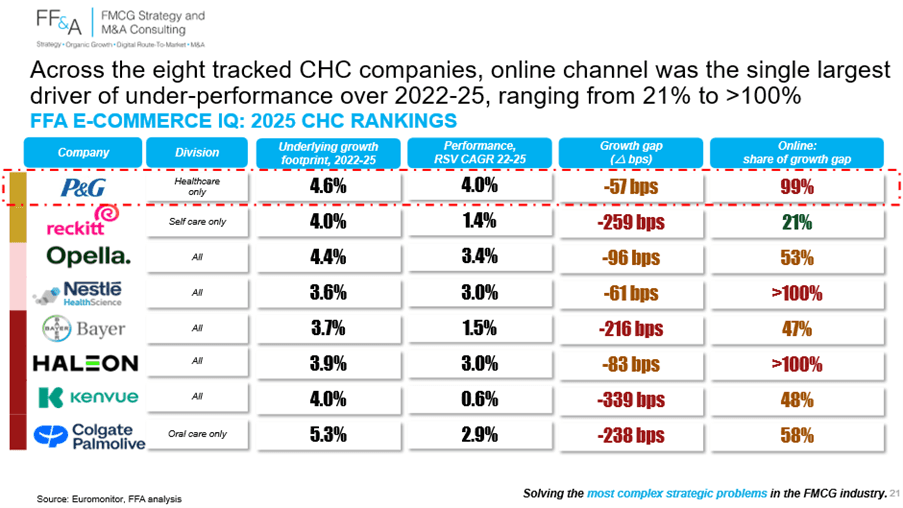
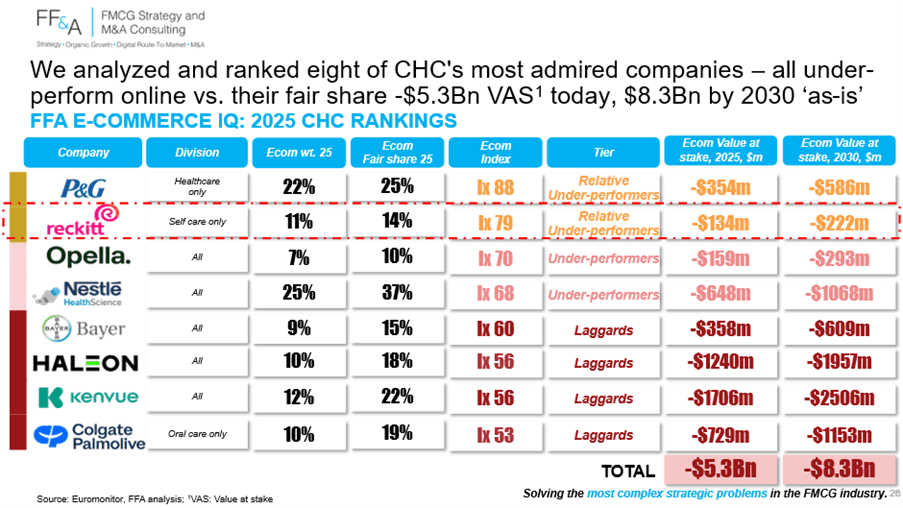
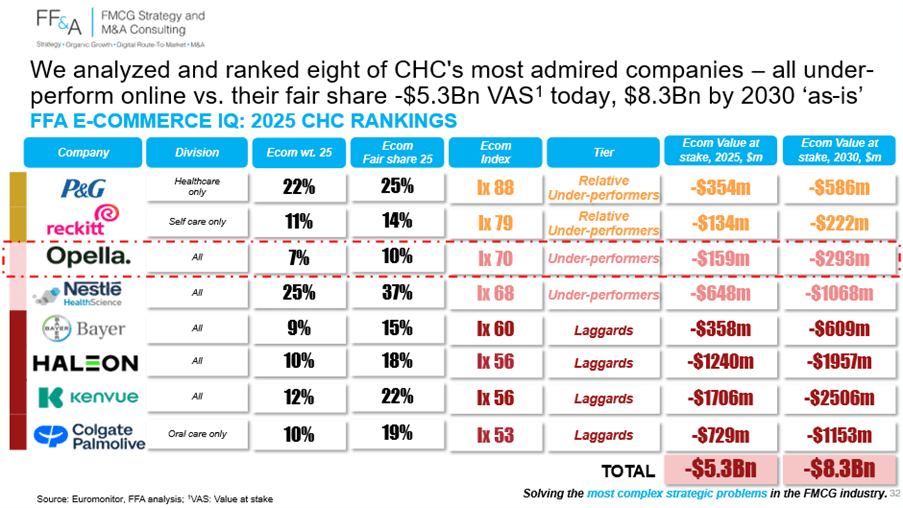
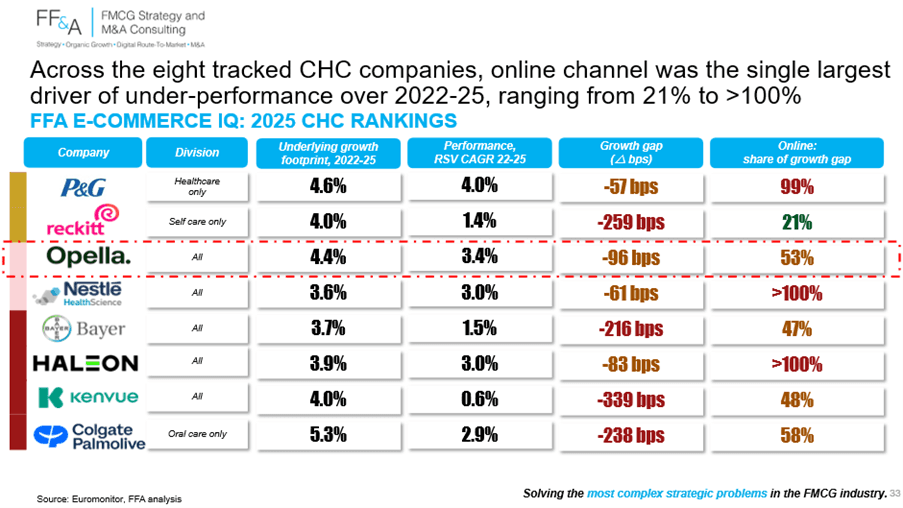
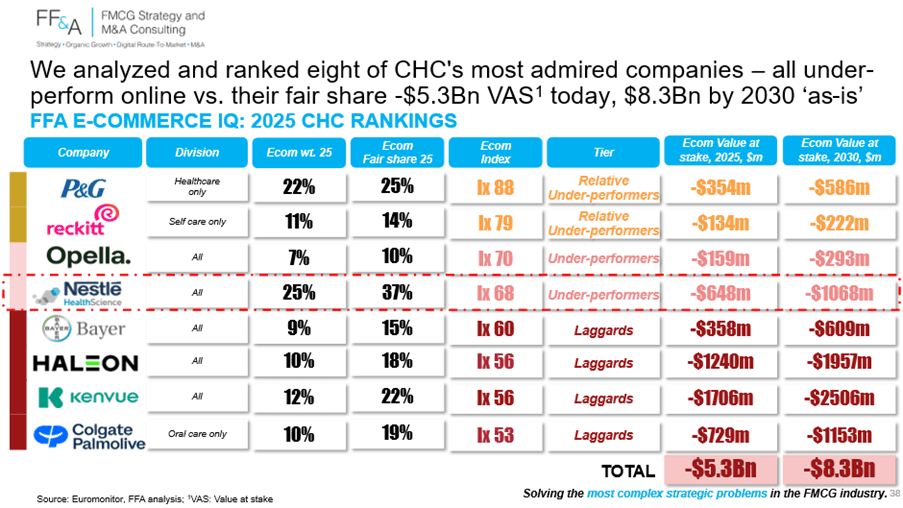
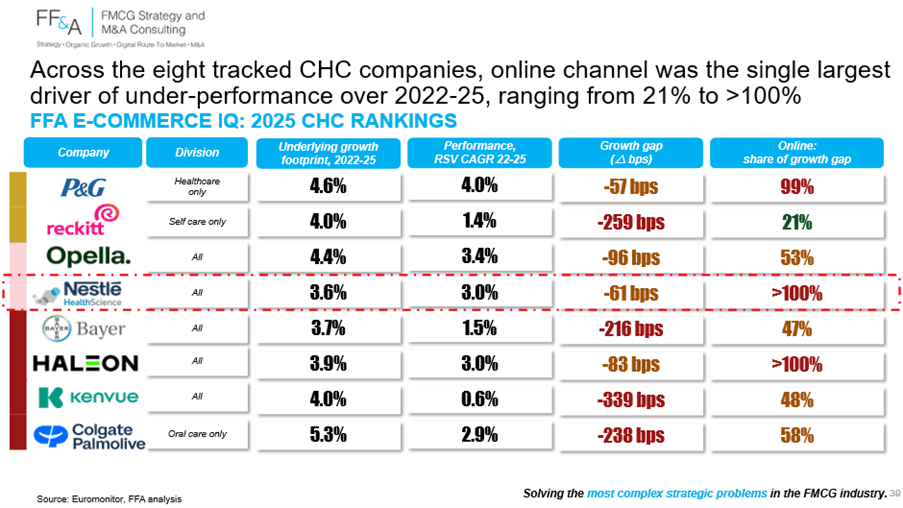
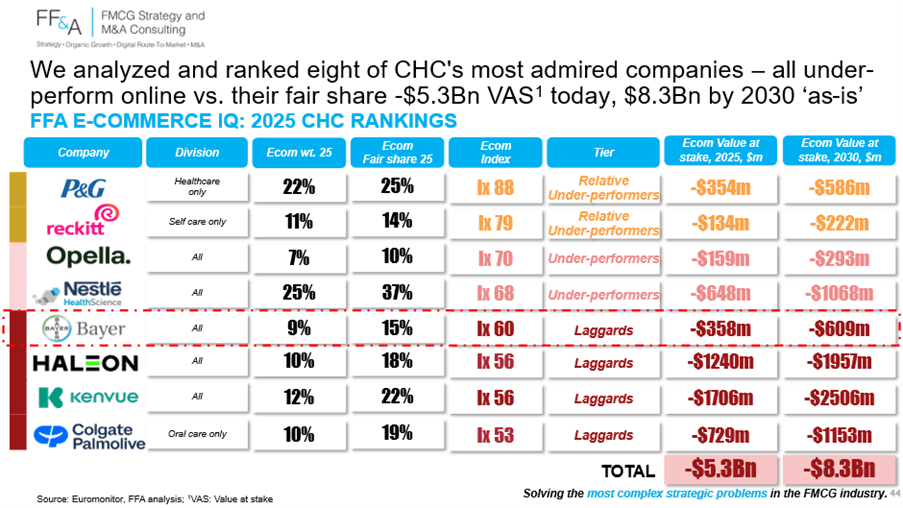
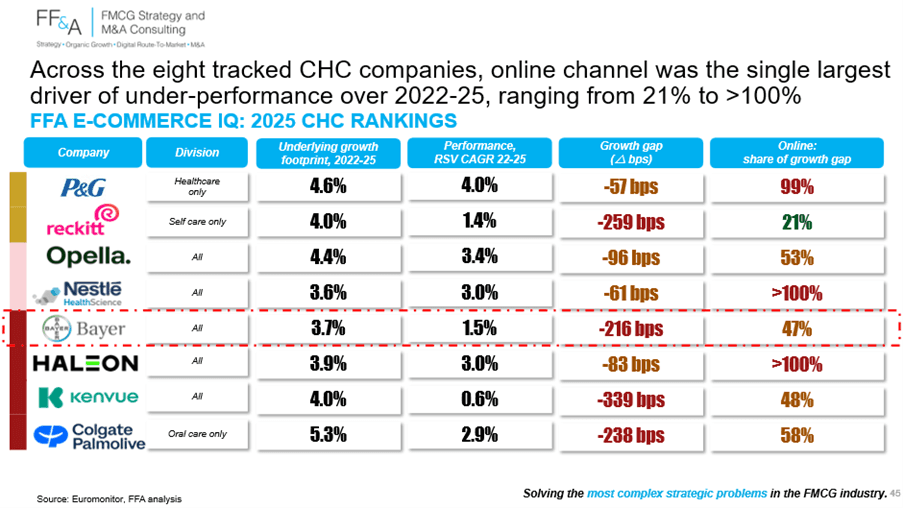
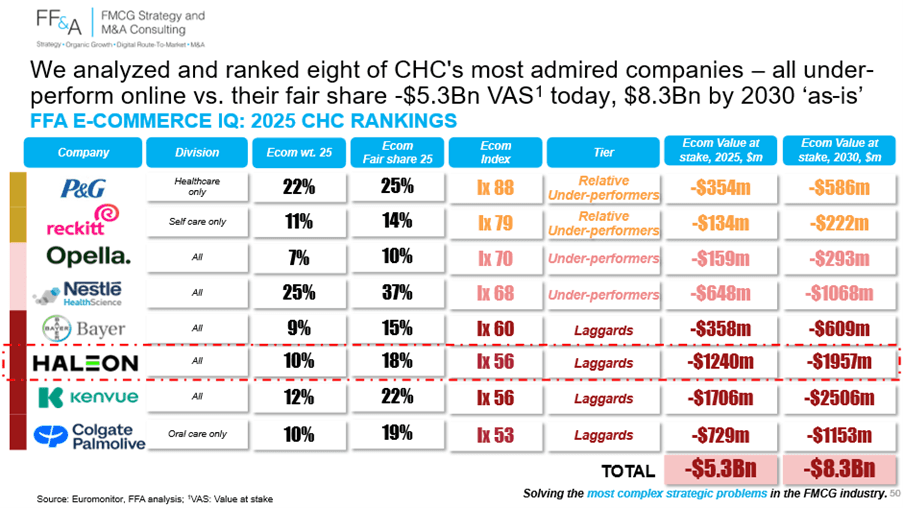
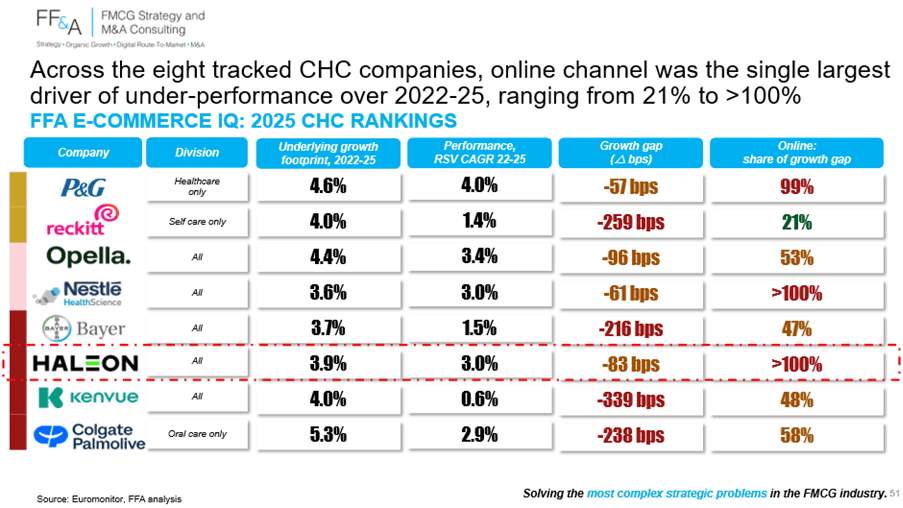
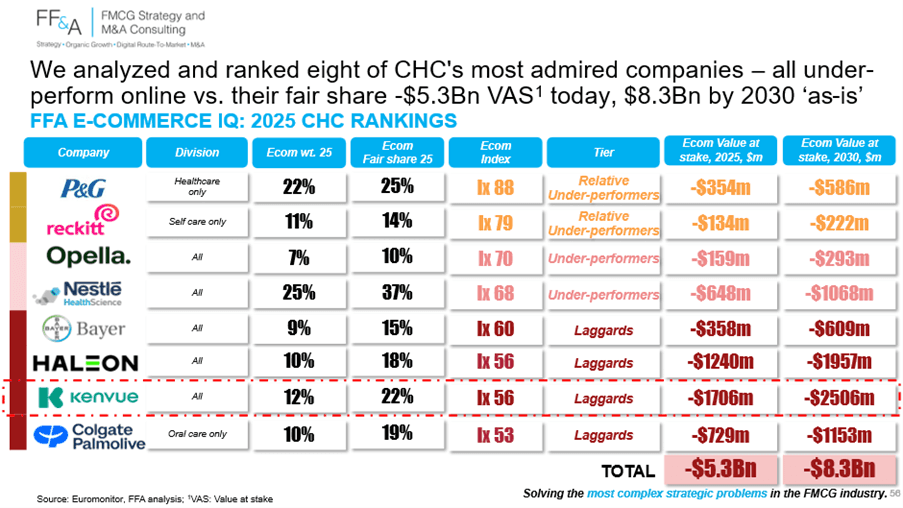
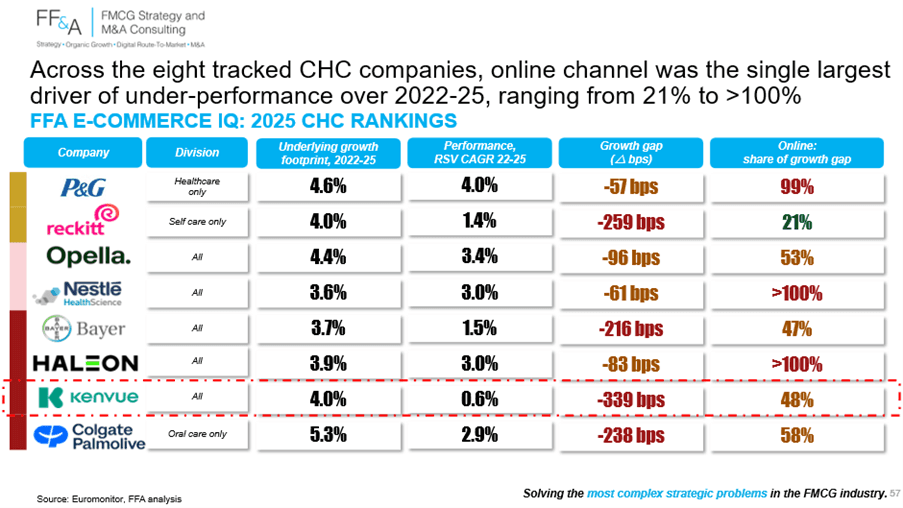
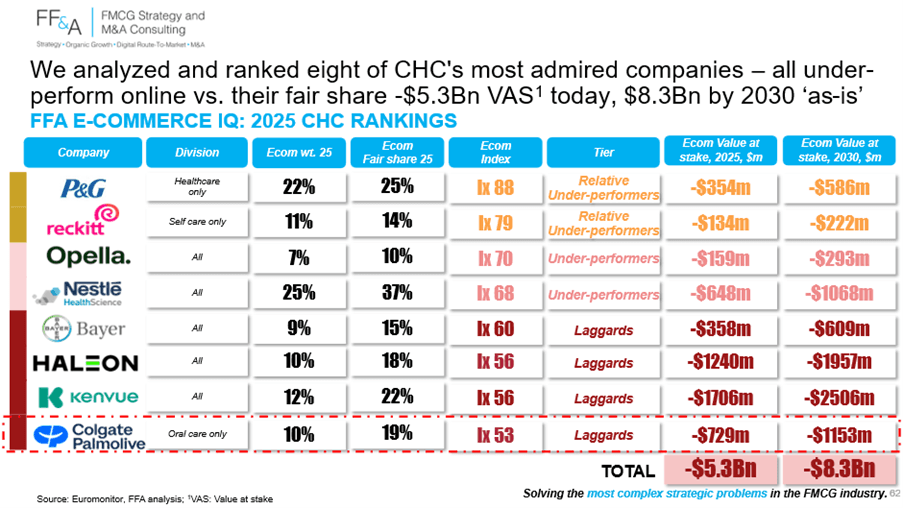
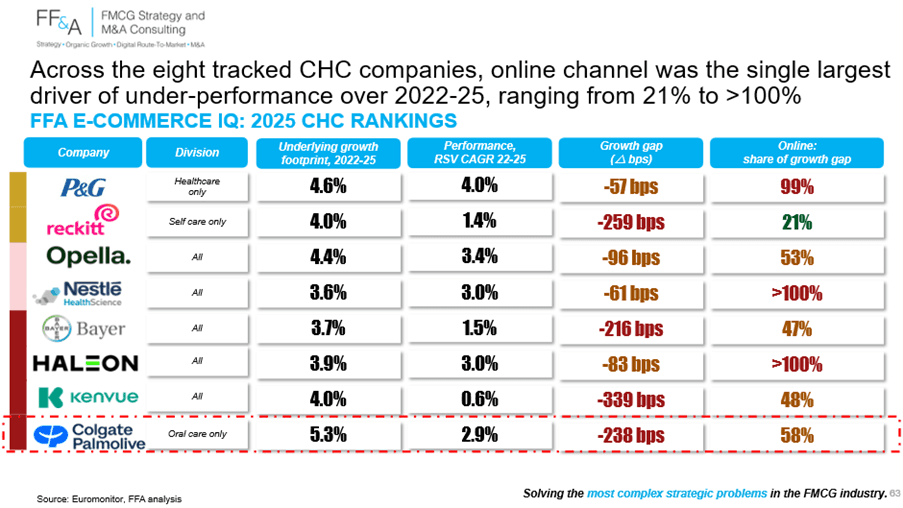
A decade in, the picture is sobering. Across the 8 most-admired CHC operators — 4 Global CHC pure players (Haleon, Kenvue, Bayer, Opella) & 4 FMCG incumbents (P&G, Nestlé Health Science, Reckitt - and Colgate Palmolive) — every single one is under-trading online, for a combined value-at-stake of ~$5.3Bn RSV in 2025, widening 'as-is' to ~$8.3Bn by 2030. Online alone explains 21% to >100% of their growth gap vs. underlying category footprint.
Put plainly: most CHC CEOs are today running a ~3% algo on the back of 5–6% growth categories — and 60–100% of that gap sits on the digital shelf.
The channel is winning; the world largest CHC players are losing.
The context demands a re-set:
Externally: e-commerce maturity highly uneven across categories (13% OTC vs. 44% VMS) & geographies (US & China = 46% of global CHC); AI-driven discovery reshaping the digital shelf; retail media inflation; intensifying challenger & private label competition
Internally: foundations in place but with unsustainable target & investment levels, where-to-play / how-to-win choices that need deep updating, and negative ripple effects on customer profitability & omnichannel value
Methodologically: every existing e-commerce index diagnoses symptoms — none is financially anchored, none prices the gap in $m, none prescribes the recovery path
This publication is the first of our FF&A E-Commerce IQ Report series that will span across key verticals — and we are kickstarting with CHC.
Our objective:
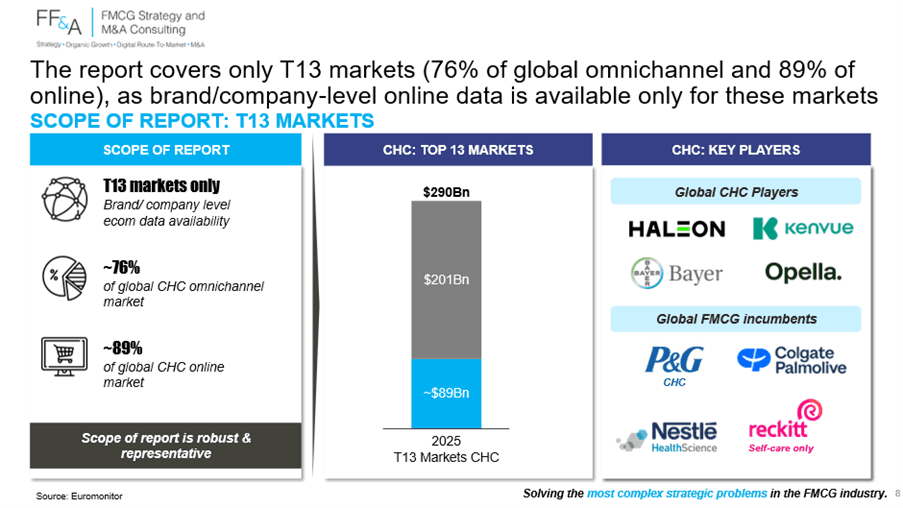
Leveraged a unique mashup of Euromonitor Passport (top-down) & the Euromonitor E-Commerce Dashboard (bottom-up) across the Top 13 CHC markets — ~76% of global CHC omnichannel & ~89% of global CHC online sales ($290Bn in scope, $89Bn already online)
Built our proprietary FF&A E-Commerce IQ Index (Index = Ecom wt. ÷ Fair share × 100; Index <100 = under-trading) — pricing the gap as Online value-at-stake ($m RSV) at country-brand level
Ranked & des-averaged 8 of CHC's most-admired players down to country-category couples — isolating the 3–4 'bleeding cells' that explain 60–100% of each company's online under-trading
Projected the 'as-is' evolution of these gaps to 2030 — to size what doing nothing really costs
Translated the diagnosis into a holistic recovery approach — FF&A E-Commerce 3.0® — built on our experience strategizing e-commerce for 7 of the world's 20 largest FMCG companies (~50+ engagements completed since 2017)
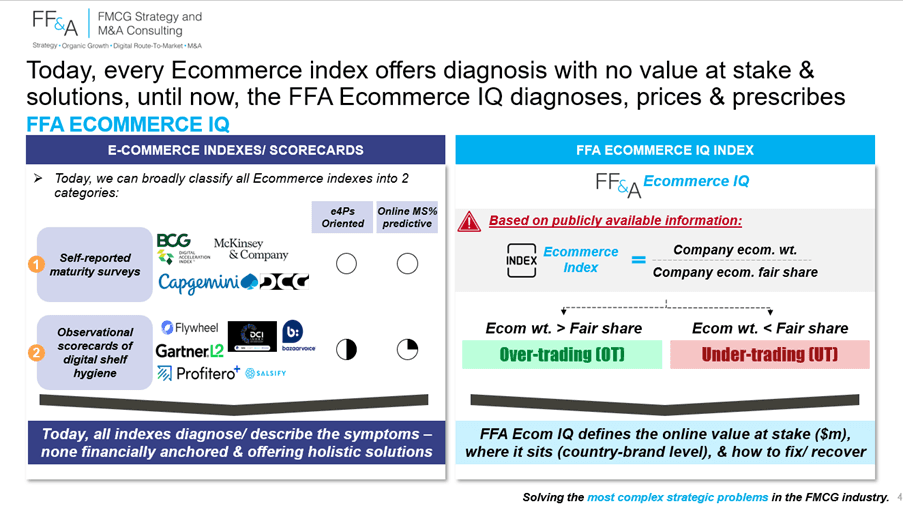
1) Introducing FF&A E-Commerce IQ + 3.0® — The Only "Diagnose, Price, Predict" Approach in the Market
Our proprietary FF&A E-Commerce IQ — is the only e-commerce index in the market that prices the value at stake in $m at country-brand level & prescribes the recovery path.
a) Today's e-commerce indexes stop at the symptoms. Existing indexes fall into one of two camps: (i) self-reported maturity surveys (e4Ps-oriented), or (ii) observational scorecards of digital shelf hygiene (content, ratings, search visibility). None financially anchored at country-brand level. None predictive of online market share. None offering a holistic recovery path.
b) FF&A E-Commerce IQ closes that gap. We benchmark each company's actual online weight against its estimated online fair share — adjusted for sub-category footprint — & price the delta in $m RSV at country-brand level:
Index = E-comm wt. ÷ Fair share × 100
Index <100 → online under-trading (value bleeding through the digital shelf)
Index >100 → online over-trading (company outperforming its fair share online)
Gap sized as Online Value at Stake ($m RSV) — financially anchored, online MS%-predictive, actionable
c) From diagnosis to prescription — the Ecommerce 3.0® flywheel.
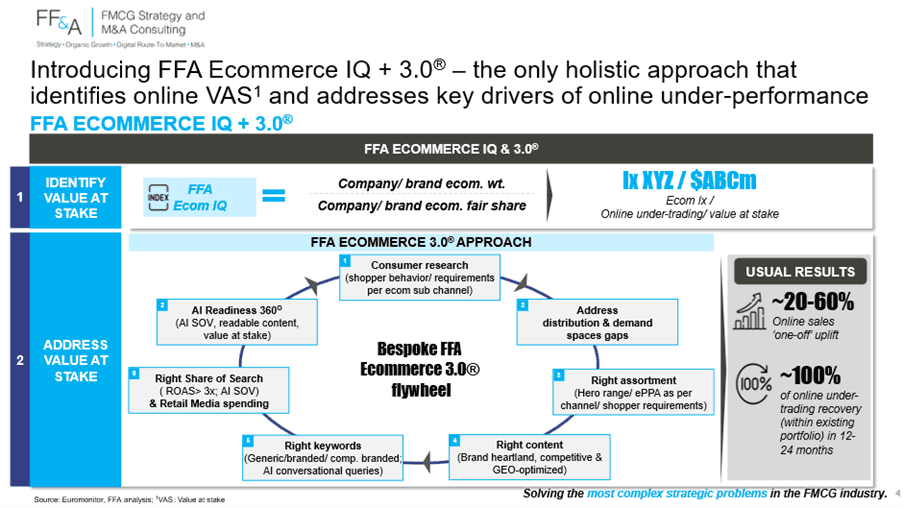
Identifying the gap is half the work. Recovery requires acting on all six drivers of online performance — what we call the FF&A Ecommerce 3.0® flywheel:
v Consumer research — shopper behaviour & requirements per e-comm sub-channel
v Distribution & demand space gaps — closing white spaces in coverage
v Right assortment — hero range / ePPA per channel & shopper
v Right content — brand heartland, competitive, GEO-optimised
v Right keywords — generic, branded, competitor-branded, AI conversational queries
v Right Share of Search + Retail Media (ROAS >3x, AI SOV) + AI Readiness 360°
d) Proven results Across CHC & adjacent verticals, FF&A E-Commerce 3.0® has consistently delivered:
- ~20–60% 'one-off' online sales uplift within the assessed scope and,
- ~100% online under-trading recovery within existing portfolio in 12–24 months.
2) CHC — A $380Bn category where online is already the growth engine
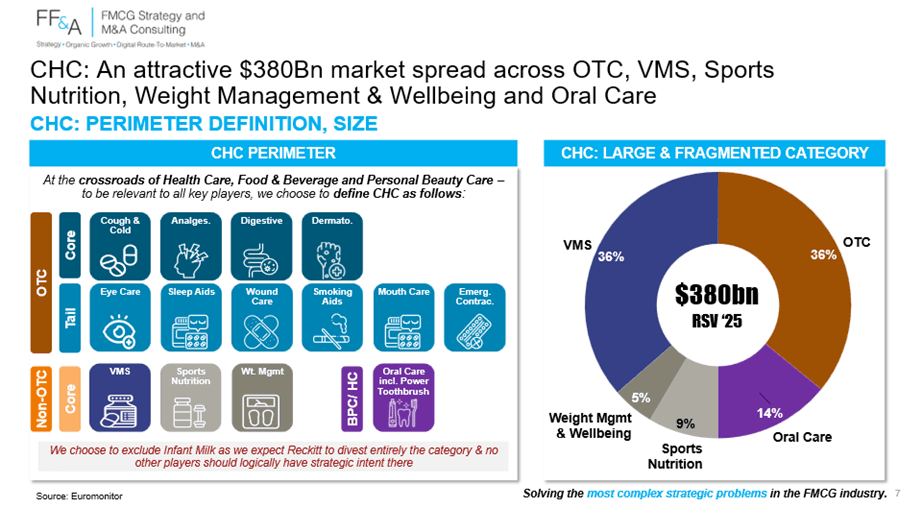
Why CHC first? CHC sits at the crossroads of Health Care, F&B & Personal Beauty Care — strategically relevant to every major FMCG, healthcare & pure-play operator:
$380Bn RSV global market in 2025
Spread across five categories:
i. OTC: $138Bn
ii. Vitamins, Minerals & Supplements: $136Bn
iii. Sports Nutrition: $53Bn
iv. Weight Management & Wellbeing: $32Bn
v. Oral Care: $19Bn
Large, fragmented & at the inflection point of digital reinvention
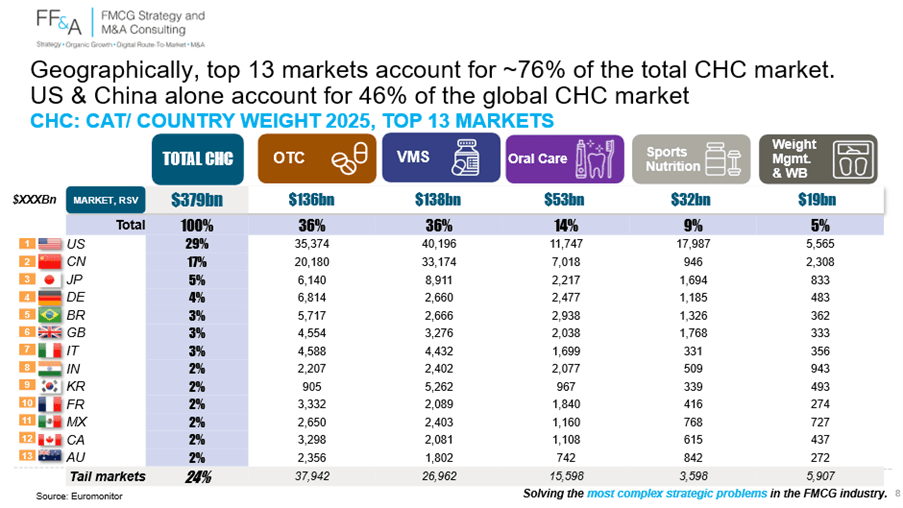
A robust, representative scope. We cover the Top 13 CHC markets:
~76% of global CHC omnichannel sales & ~89% of global CHC online sales
~$290Bn in scope, ~$89Bn already online
Anchored by the US & China alone (46% of global CHC) — both markets where the online channel is most decisive
Complemented by Japan, Germany, Brazil, UK, Italy, India, South Korea, France, Mexico, Canada & Australia
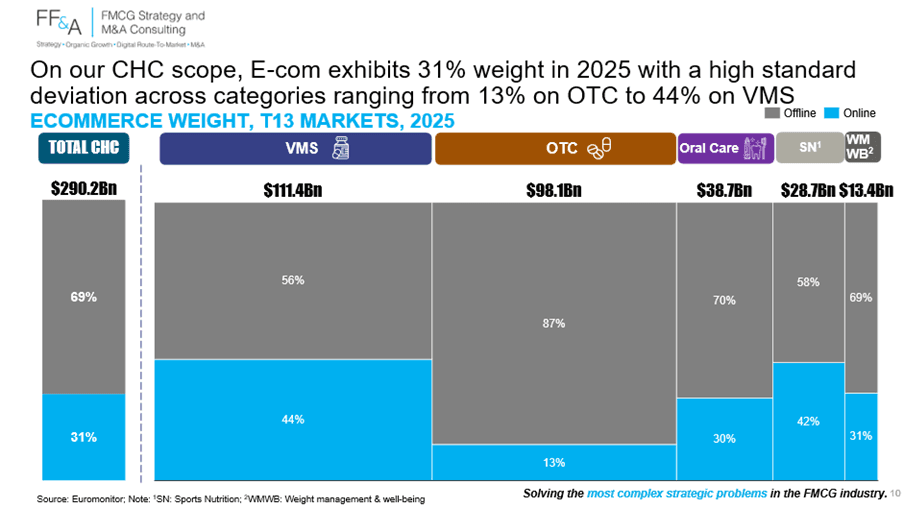
Online is already the growth engine — not a side channel. Three numbers that should re-set every CHC CEO's where-to-play conversation:
i. 31% of T13 CHC value is already online in 2025 — with a high standard deviation across categories:
OTC: 13%
Oral Care: 30%
WMWB: 31%
Sports Nutrition: 42%
VMS: 44%
ii. This standard deviation signals sharply different where-to-play priorities by sub-category.
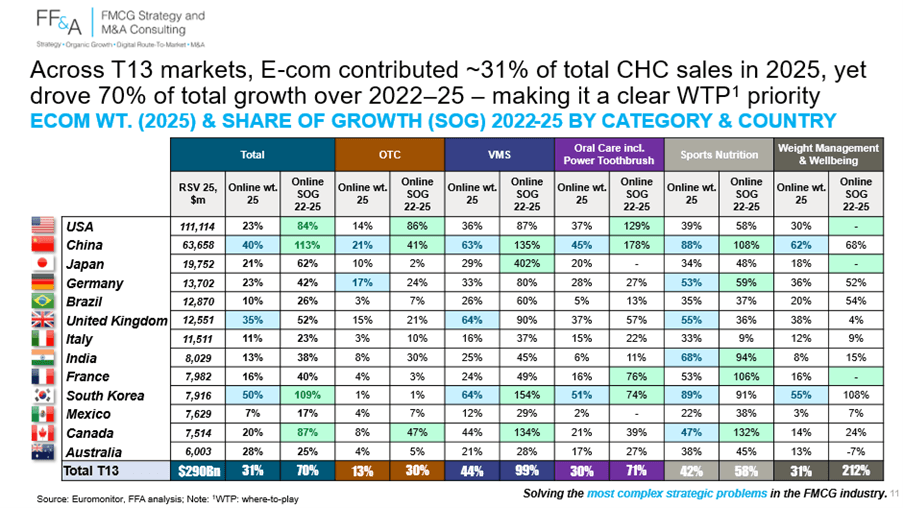
iii. 70% of total CHC growth over 2022–25 came from online — the channel is no longer 'contributing' to growth, it is the growth
iv. By 2030, online will reach 39% weight & will drive ~76% of CHC growth at an online CAGR of 9.4% (2025–30E)
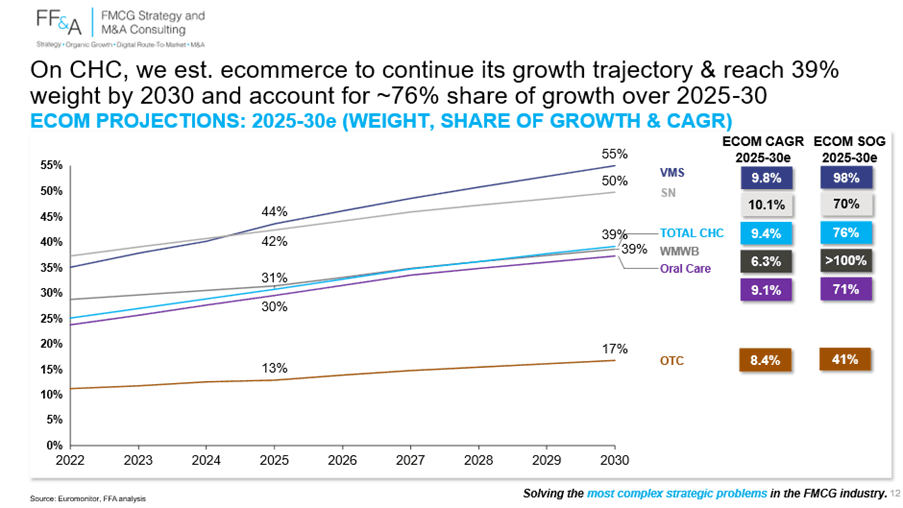
If you are still managing online as 'a channel' rather than as the primary growth engine of CHC over 2025–30, you are already losing the next quinquennial
The remainder of this report quantifies how much — for the 8 most-admired CHC operators — & prescribes where to act first:
3) The Verdict — All 8 Most-Admired CHC Operators Are Under-Trading Online
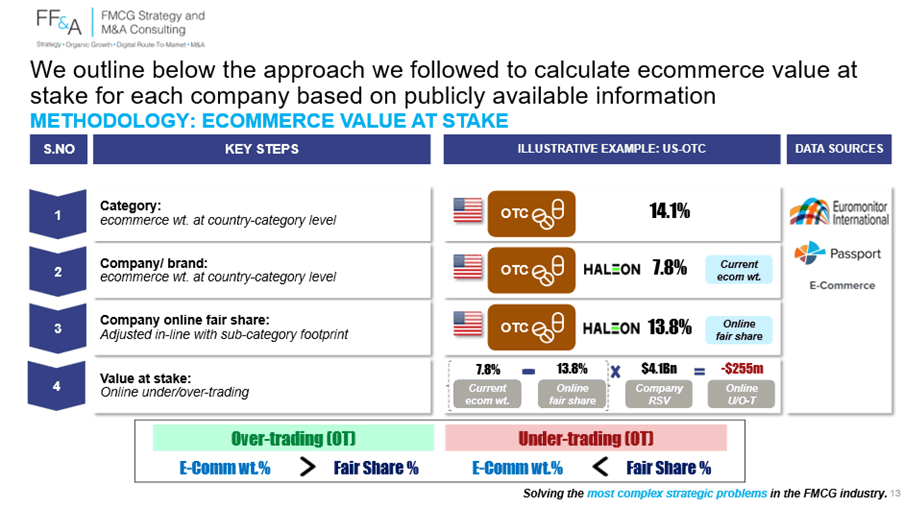
Methodology — how we sized the gap. For each company, a four-step calculation at country-category level:
i. Category e-commerce weight at country-category level (Euromonitor Passport)
ii. Company/brand e-commerce weight at country-category level (Euromonitor E-Commerce Dashboard)
iii. Company online fair share — adjusted for sub-category footprint
iv. Value-at-stake — online under/over-trading sized in $m RSV
Who we analysed?
Eight of CHC's most-admired operators, split evenly across two cohorts:
4 Global CHC pure players: Haleon, Kenvue, Bayer, Opella
4 FMCG incumbents in CHC: P&G CHC, Colgate-Palmolive, Nestlé Health Science, Reckitt (self-care only)
The verdict is unanimous — all 8 under-trade online vs. their fair share:
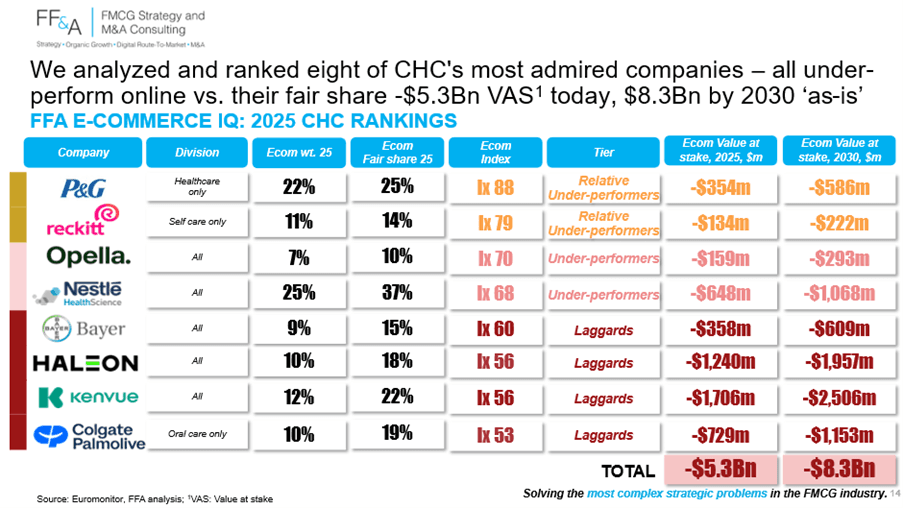
Combined online value-at-stake: ~$5.3Bn RSV in 2025, widening 'as-is' to ~$8.3Bn by 2030
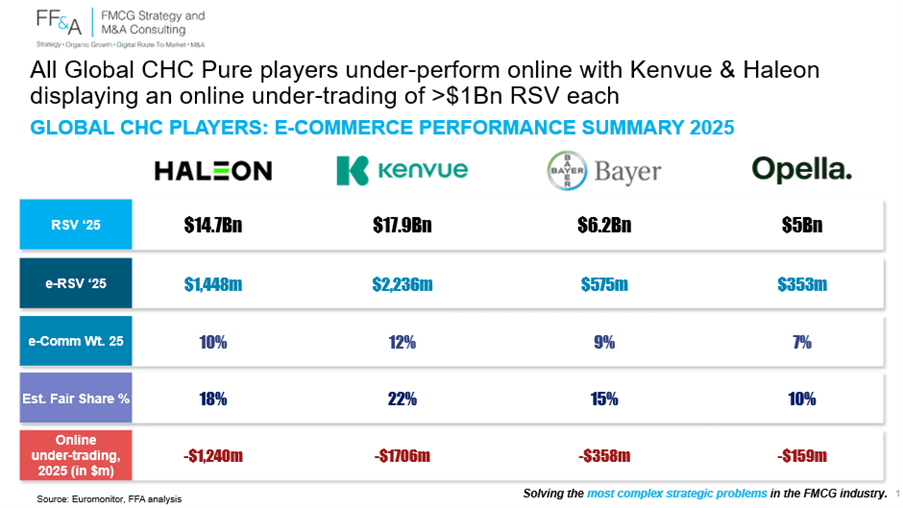
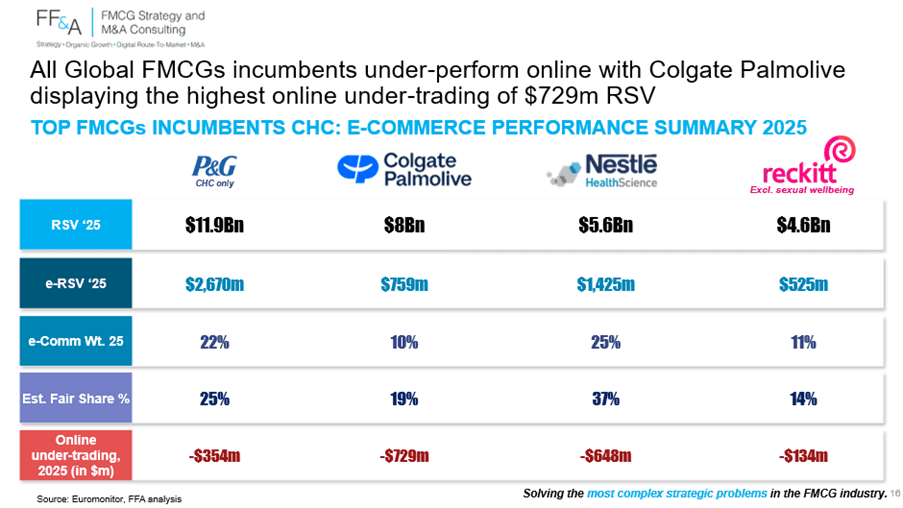
Index scores range from 88 (P&G CHC, relative under-performer) down to the laggards in the 50s — no single company at or above its fair share
Tier-wise:
i. Relative under-performers: P&G CHC (Ix 88), Reckitt (Ix 79)
ii. Under-performers: Opella (Ix 70), Nestlé Health Science (Ix 68)
iii. Laggards: Bayer (Ix 60), Haleon (Ix 56), Kenvue (Ix 56) and Colgate-Palmolive (Ix 53)
4) Online Is The #1 Driver of Growth Under-Performance for CHC Companies
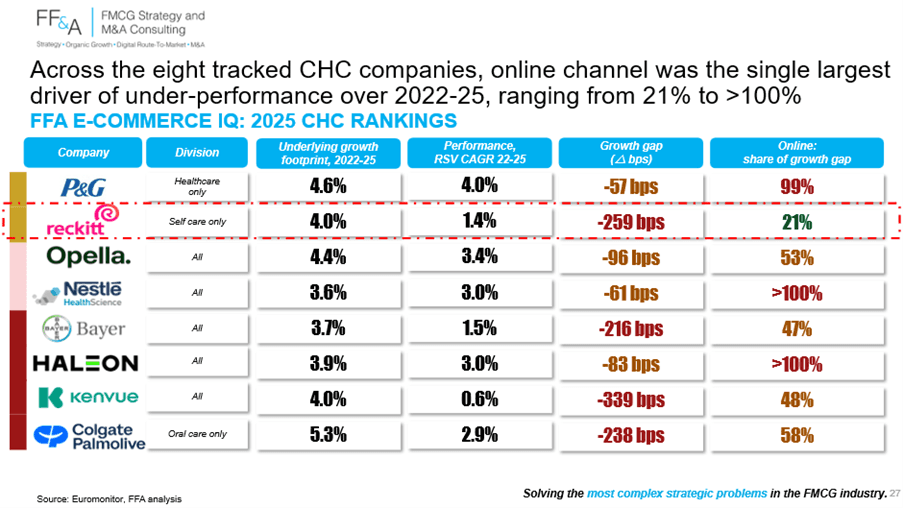
Across the 8 tracked CHC companies over 2022–25, online channel was THE single largest driver of growth under-performance vs. their underlying category growth footprint

5. P&G Healthcare (Ix 88) — Half Blind in the Kingdom of the Blind
The 'relative outperformer' of all 8 tracked companies — yet still under-trading online
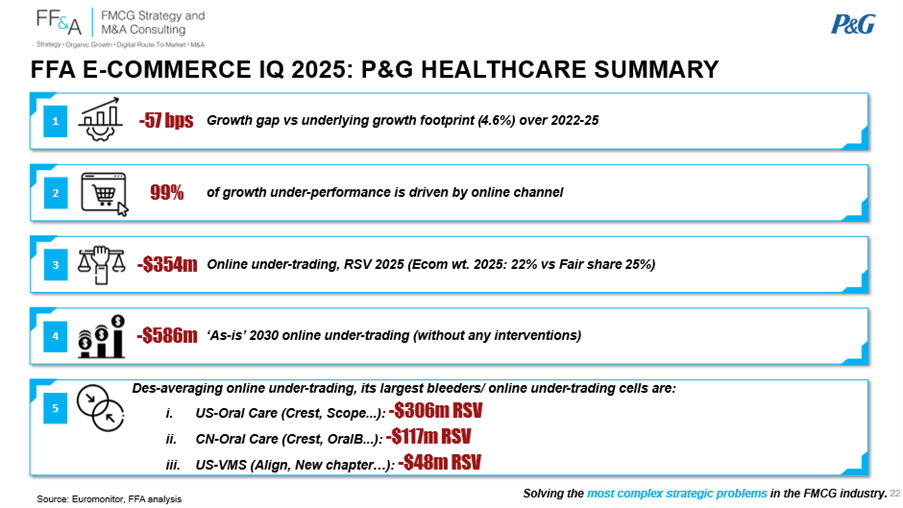
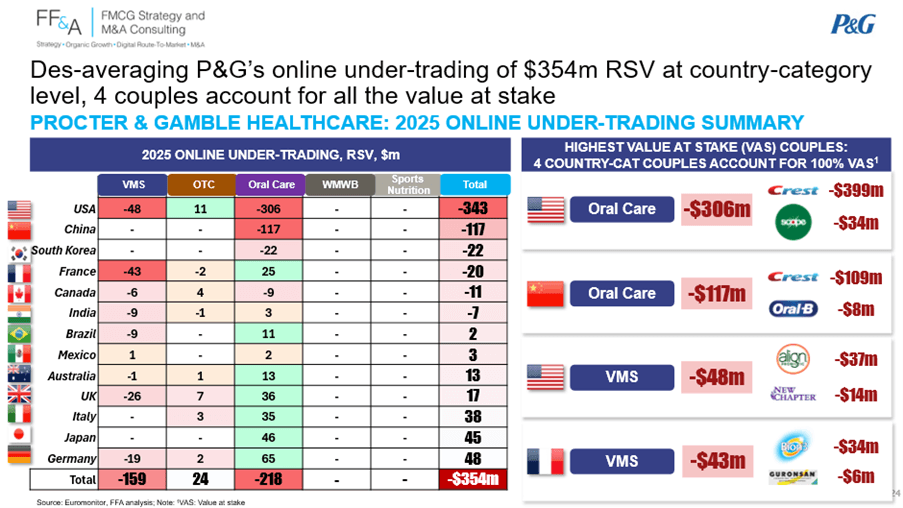
99% of P&G CHC's growth gap is online-driven (gap: -57 bps over 2022–25)
22% E-comm weight vs. 25% fair share → online costing P&G CHC -$354m RSV today, widening to -$586m by 2030e (+66%)
~60% of the bleed in Oral Care (Crest, Scope, Oral-B…) — with US-Oral Care alone at -$306m
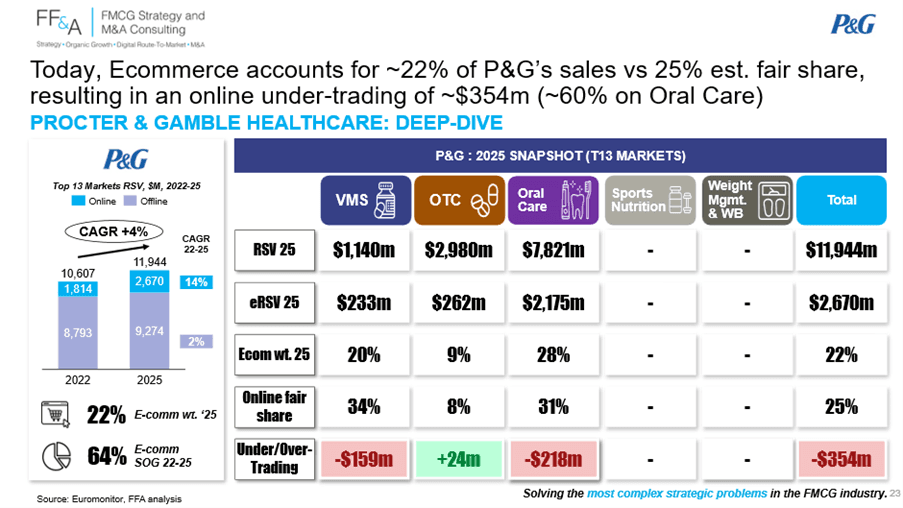
4 country-category couples account for 100% of VAS:
i. US - Oral Care: -$306m
ii. China - Oral Care: -$117m
iii. US - VMS: -$48m
iv. France - VMS: -$43m
6) Reckitt Self Care (Ix 79) — Small Wound, Fast Clock
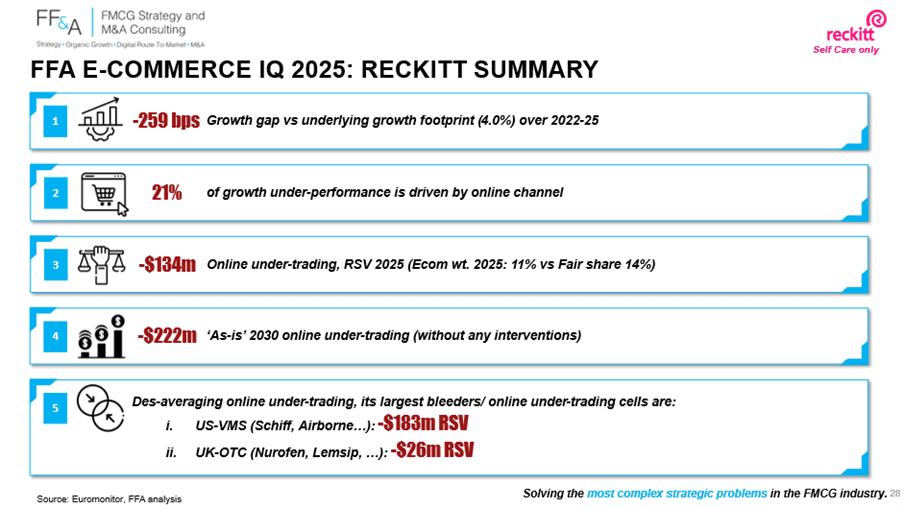
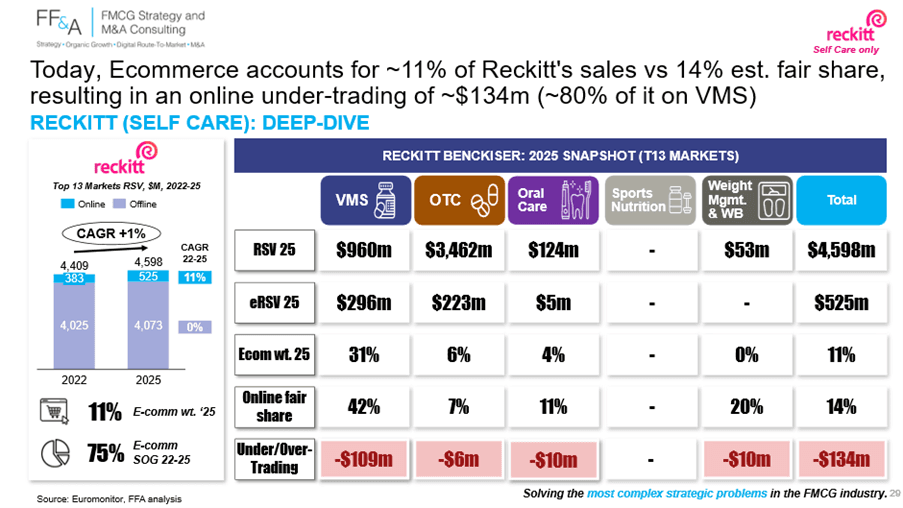
The 2nd-best index of the cohort — yet the widest underlying growth gap vs. footprint at -259 bps (CAGR 1.4% vs. 4.0% footprint)
11% E-comm weight vs. 14% fair share → online costing Reckitt -$134m RSV today, widening to -$222m by 2030e (+65%)
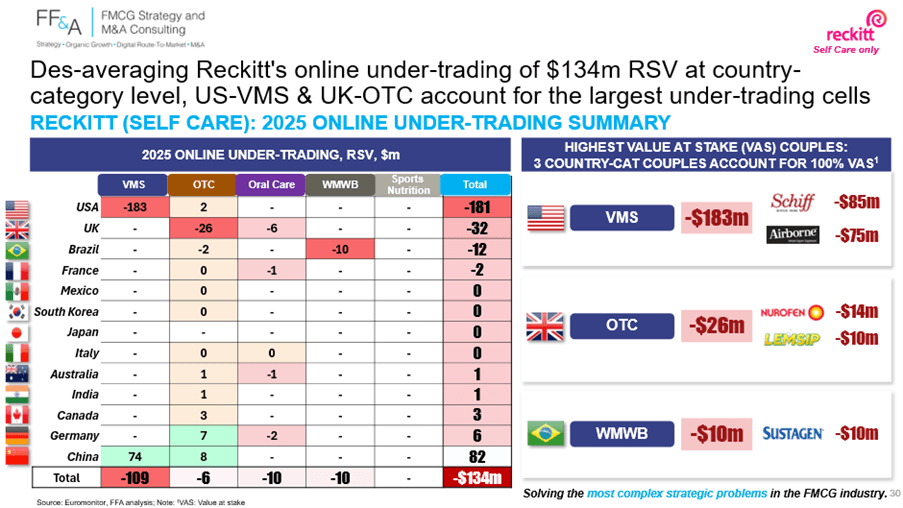
~80% of the bleed in VMS (Schiff, Airborne), with US - VMS alone at -$183m & UK - OTC (Nurofen, Lemsip) the next bleeder
3 country-category couples account for 100% of VAS: i. US – VMS: -$183m ii. UK – OTC: -$26m iii. Brazil – Weight Management & Wellbeing: -$10m
7) Opella (Ix 70) — Freshly Created, Fastest Bleeding
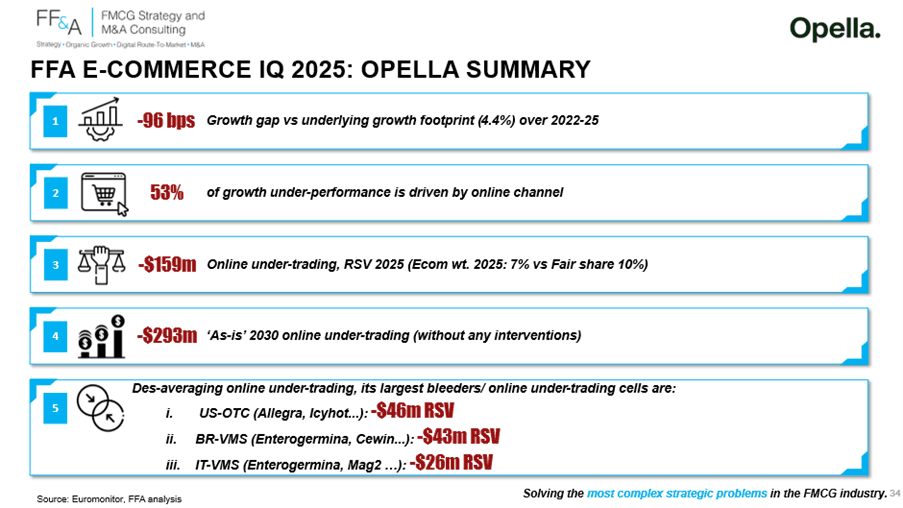
The newest standalone of the cohort — & the steepest 'as-is' bleed trajectory of all 8 tracked companies (+84% to 2030e)
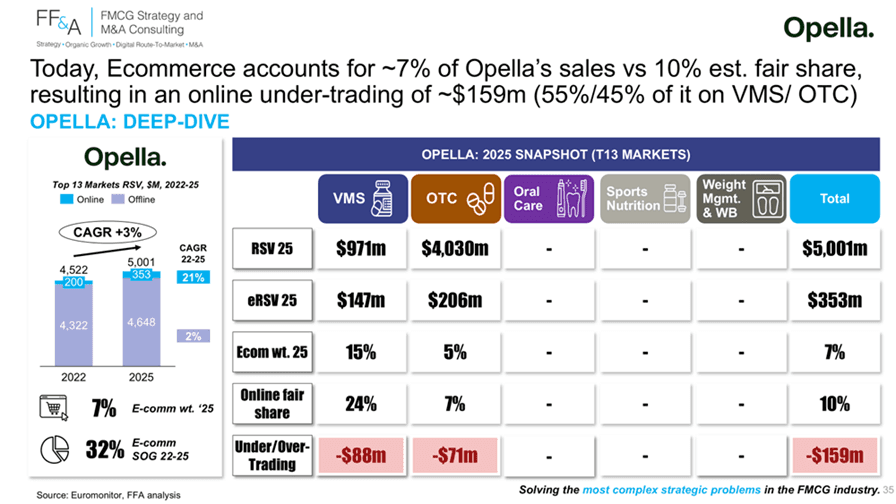
7% E-comm weight vs. 10% fair share → online costing Opella -$159m RSV today, widening to -$293m by 2030e (+84%)
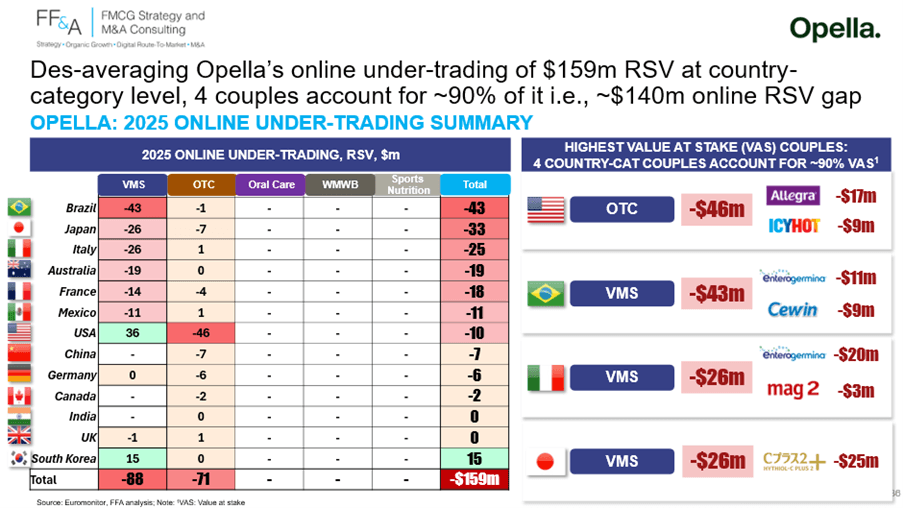
Split 55%/45% across VMS & OTC (Enterogermina, Cewin, Mag 2, Allegra, Icyhot…) — concentrated in Brazil, Italy & US
4 country-category couples account for ~90% of VAS: i. US - OTC: -$46m ii. Brazil - VMS: -$43m iii. Italy - VMS: -$26m iv. Japan - VMS: -$26m
8. Nestlé Health Science (Ix 68) — The Mirage of Online Maturity
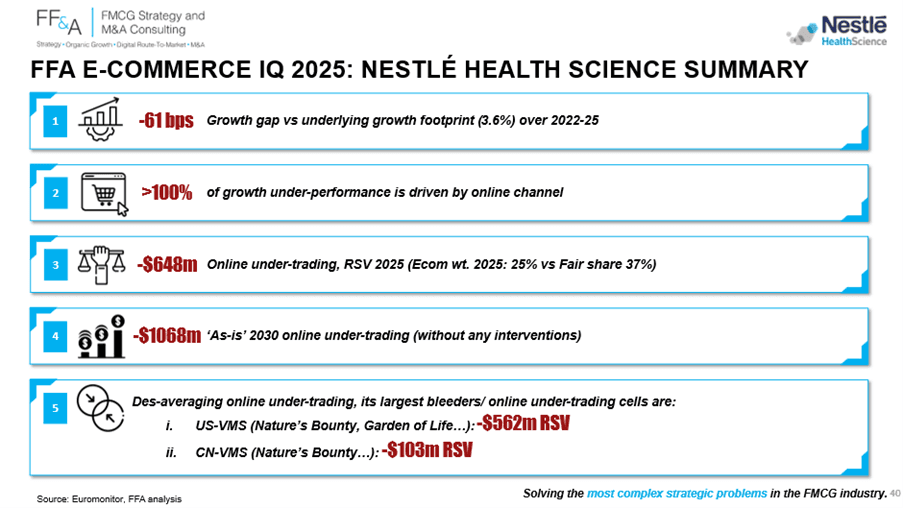
The deceptive 25% online weight that hides a 37% fair share & >100% of the growth gap (gap: -61 bps, ~entirely online-driven)
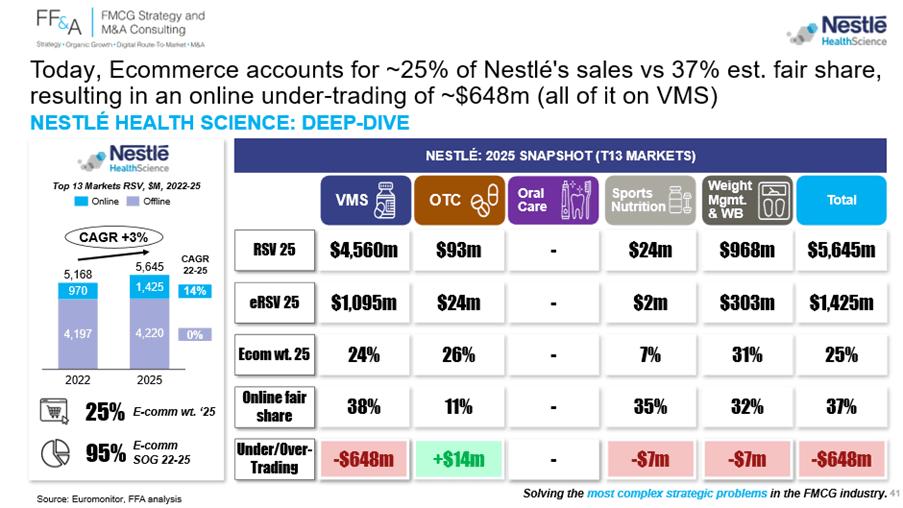
25% E-comm weight vs. 37% fair share → online costing NHSc -$648m RSV today, widening to -$1,068m by 2030e (+65%)
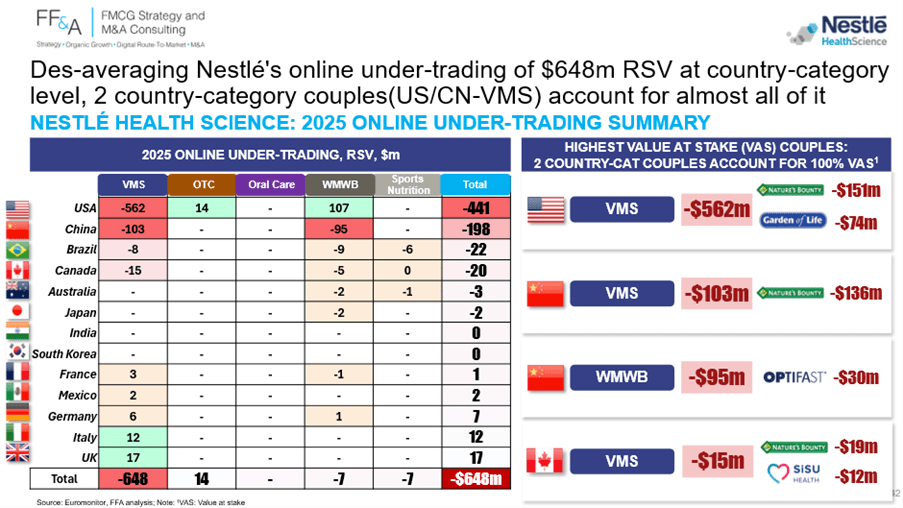
100% of the bleed in VMS (Nature's Bounty, Garden of Life…) — with US-VMS alone at -$562m (87% of total VAS)
2 country-category couples account for ~100% of VAS: i. US - VMS: -$562m ii. China - VMS: -$103m
9. Bayer Consumer (Ix 60) — Pharma Reflexes in an Online Fight
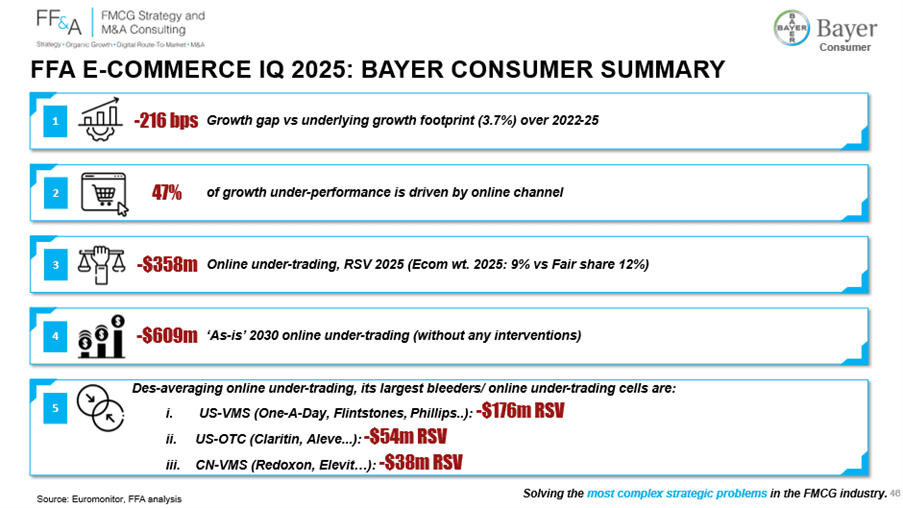
A pharma-rooted operator navigating an FMCG-paced online fight — with a wide growth gap of -216 bps despite a 3.7% category footprint
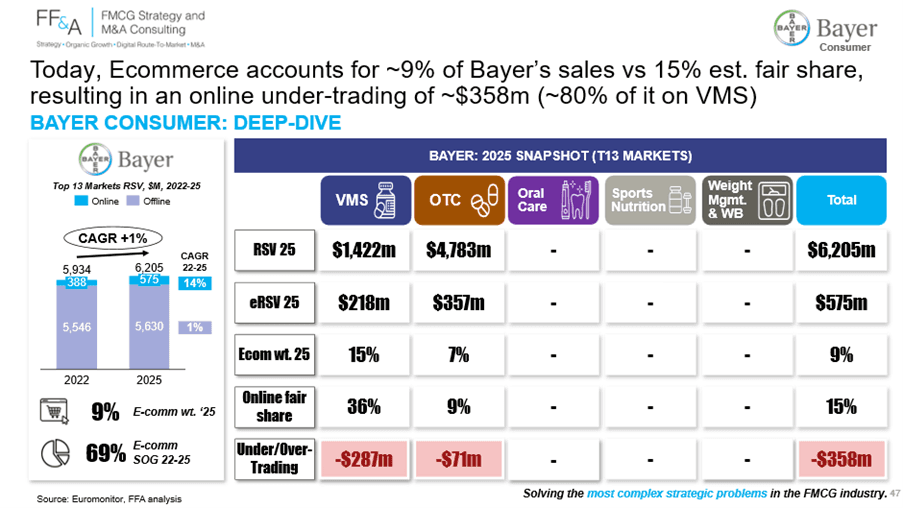
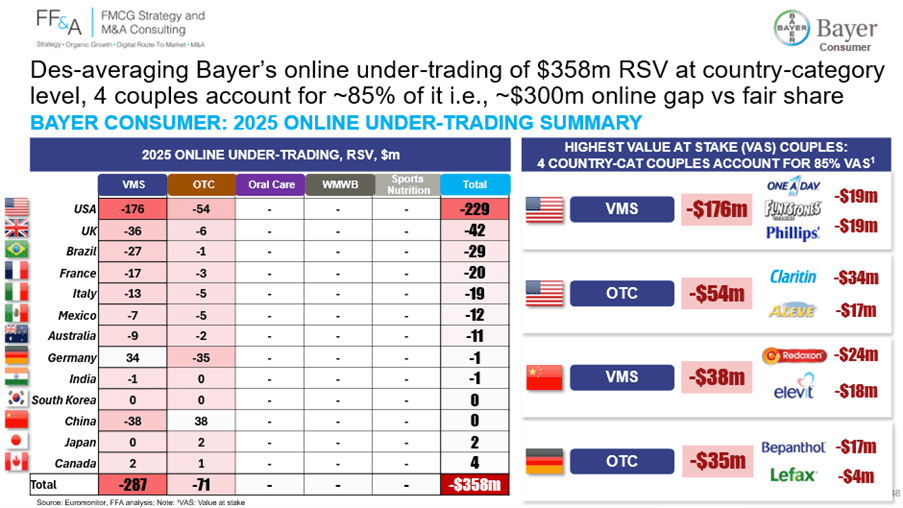
9% E-comm weight vs. 15% fair share → online costing Bayer -$358m RSV today, widening to -$609m by 2030e (+70%)
~80% of the bleed in VMS (One-A-Day, Flintstones, Phillips, Redoxon, Elevit…), with US-VMS alone at -$176m
4 country-category couples account for ~85% of VAS: i. US - VMS: -$176m ii. US - OTC (Claritin, Aleve): -$54m iii. China - VMS (Redoxon, Elevit): -$38m iv. Germany - OTC: -$35m
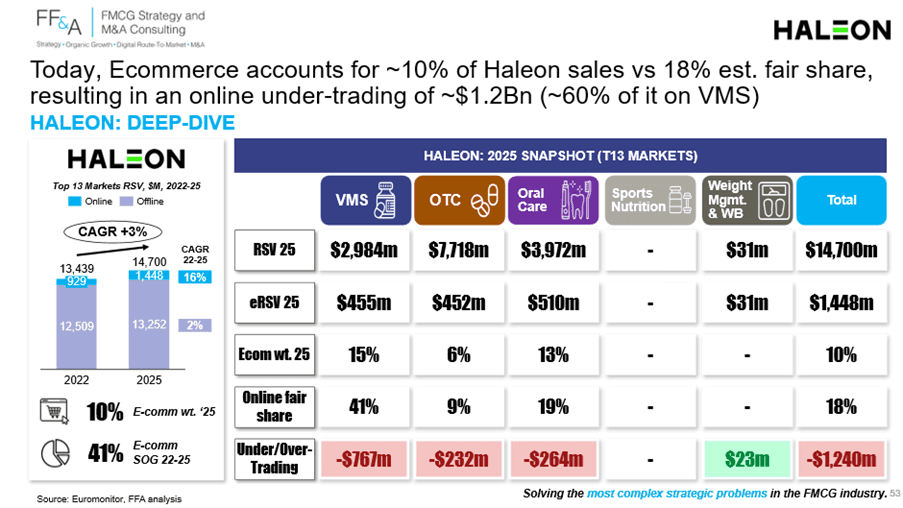
10) Haleon (Ix 56) — A Growth Gap All Driven By Online
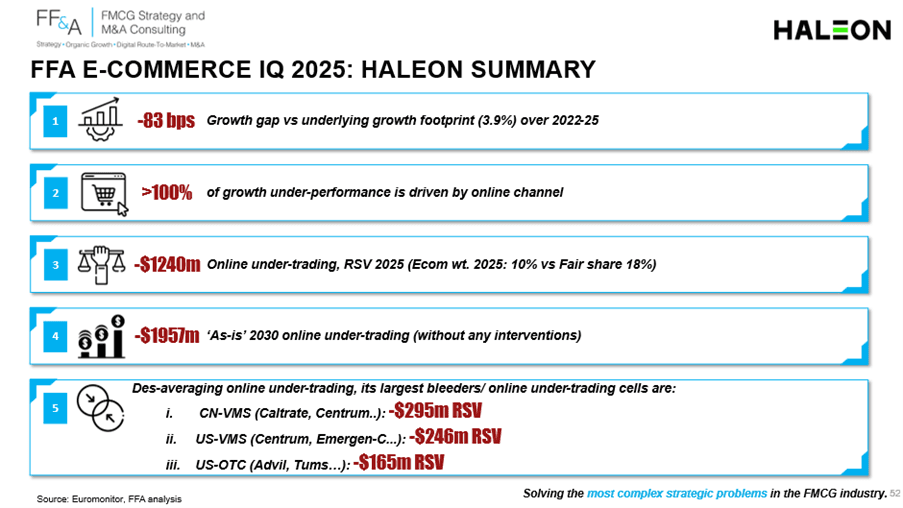
Carved out of GSK in 2022 with a single mandate — lead in Consumer Health. Reality: tied at the bottom of the index ranking with >$1Bn online bleed
10% E-comm weight vs. 18% fair share → online costing Haleon -$1,240m RSV today, widening to -$1,957m by 2030e (+58%)
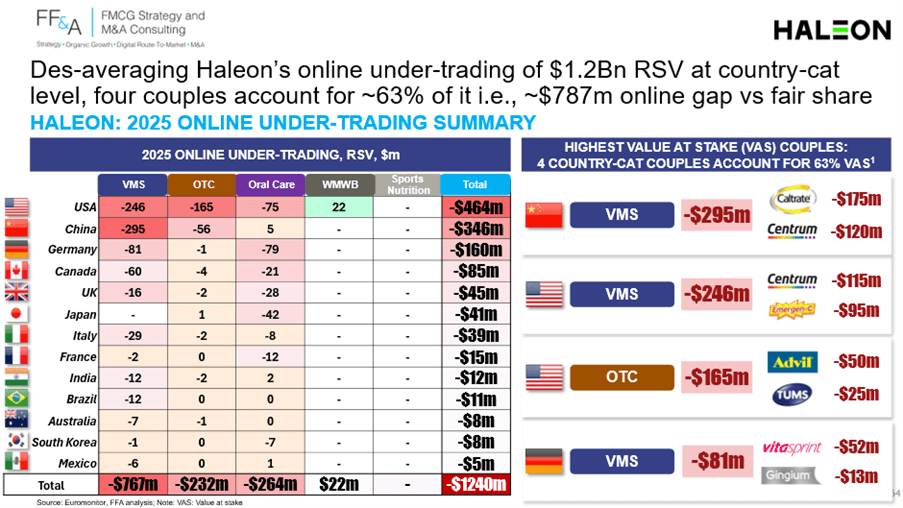
~60% of the bleed in VMS (Centrum, Caltrate, Emergen-C…), with CN-VMS & US-VMS combined at -$541m
4 country-category couples account for ~63% of VAS: i. China - VMS: -$295m ii. US - VMS: -$246m iii. US - OTC (Advil, Tums): -$165m iv. Germany - VMS: -$81m
11. Kenvue (Ix 56) — The Largest Under-Trading Among CHC Pure Players (12% vs. 22% fair share)
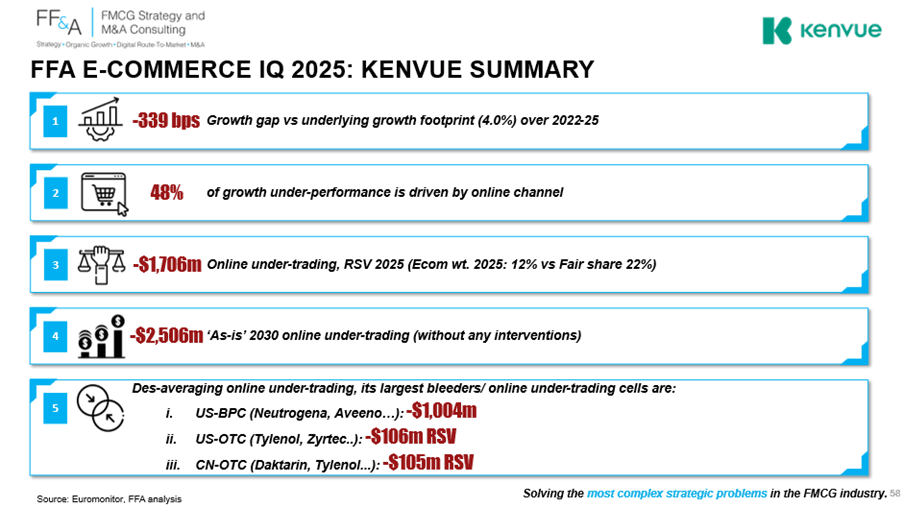
The single biggest online bleed of all 8 tracked (-$1,706m) — & the widest underlying growth gap at -339 bps (CAGR 0.6% vs. 4.0% footprint)
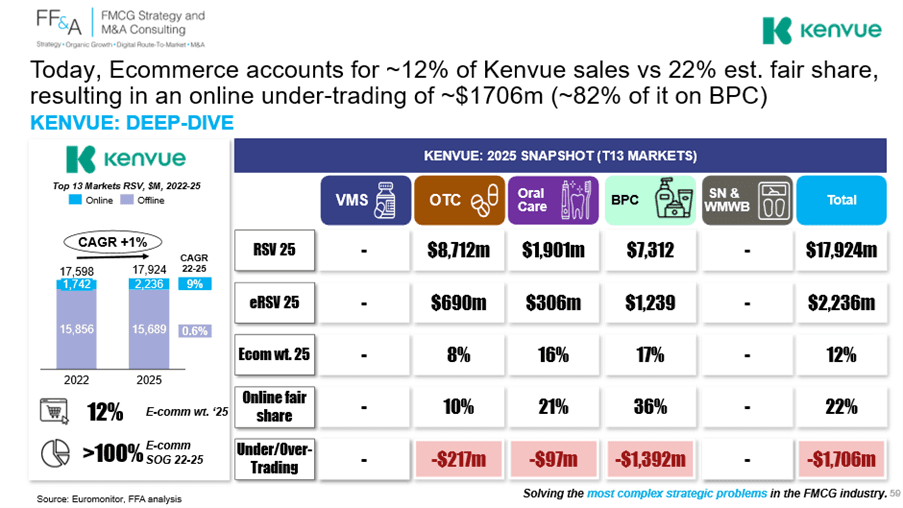
12% E-comm weight vs. 22% fair share → online costing Kenvue -$1,706m RSV today, widening to -$2,506m by 2030e (+47%)
~82% of the bleed in Beauty & Skincare (Neutrogena, Aveeno…) — the very categories that should be Kenvue's online stronghold
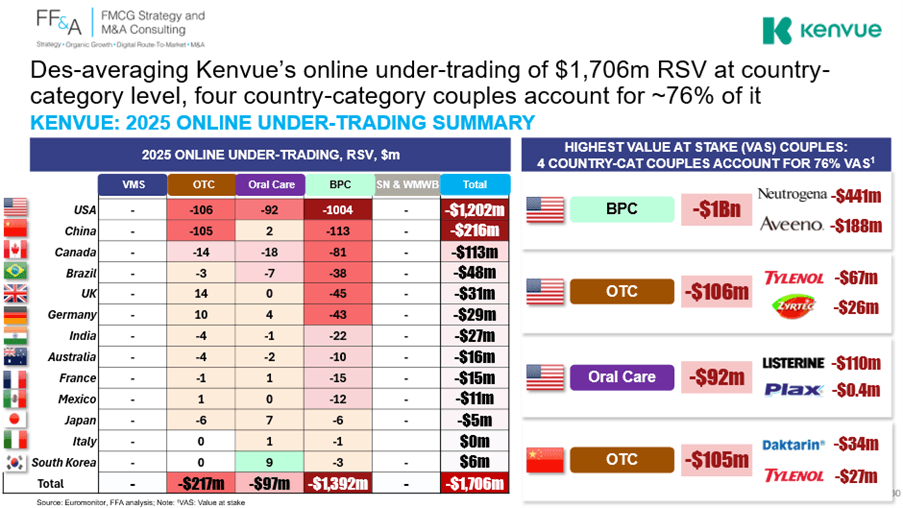
The US alone drives ~$1.2Bn / ~70% of the total bleed: ~$1Bn BPC, ~$106m OTC, ~$92m Oral Care
4 country-category couples account for ~76% of VAS: i. US - BPC: -$1,004m ii. US - OTC (Tylenol, Zyrtec): -$106m iii. China - OTC (Daktarin, Tylenol): -$105m iv. US - Oral Care (Listerine, Plax): -$92m
12. Colgate-Palmolive Oral Care (Ix 53) — The Simplest Footprint, The Most Painful Bleed
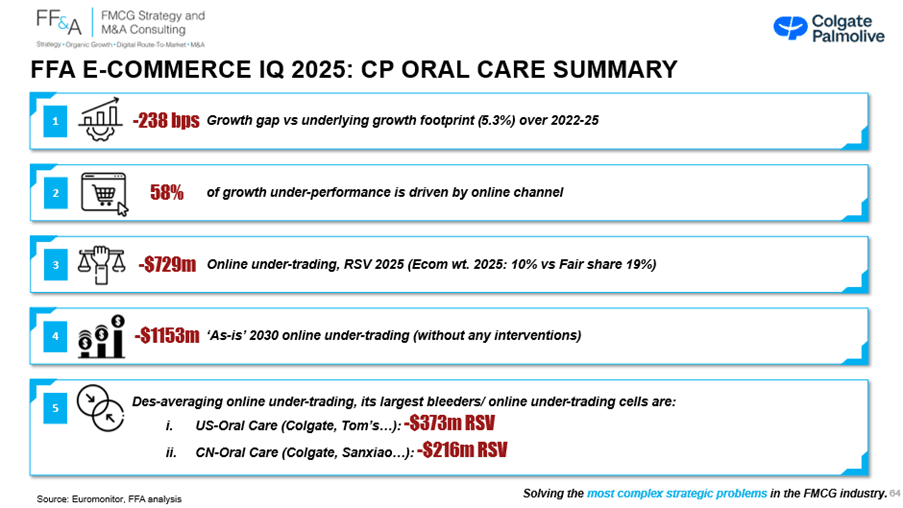
The lowest index score among all 8 tracked (Ix 53) — & the 3rd-widest growth gap at -238 bps (CAGR 2.9% vs. 5.3% footprint)
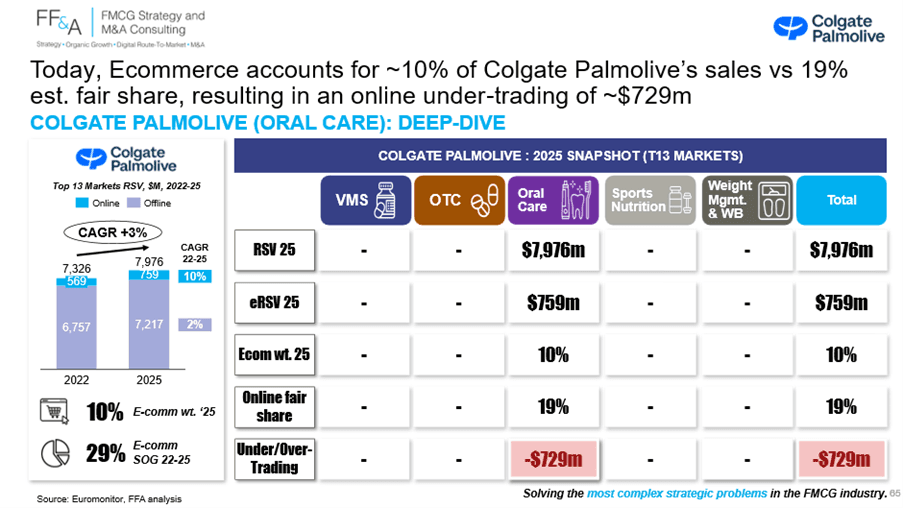
10% E-comm weight vs. 19% fair share → online costing CP -$729m RSV today, widening to -$1,153m by 2030e (+58%)
100% of the bleed in Oral Care (Colgate, Tom's of Maine, Sanxiao…) — a single-category portfolio by design, with no diversification to hide the gap
2 country-category couples account for ~80% of VAS: i. US - Oral Care: -$373m ii. China - Oral Care: -$216m

13. Introducing FF&A E-commerce 3.0® — The Recovery Path
The bleed will not self-correct — $5.3Bn in 2025 compounds to $8.3Bn by 2030 'as-is', purely from doing nothing
The next 5 years will separate CHC online Outperformers from the rest — the gap between Winners & Losers only widens between 2025 & 2030
FF&A Ecommerce 3.0® — the only holistic, AI-enabled approach acting on all 6 drivers of online performance (Consumer research → Distribution & demand gaps → Right assortment → Right content → Right keywords → Right SOS + Retail Media + AI Readiness 360°)
Track record across CHC & adjacent verticals: ~20–60% 'one-off' online sales uplift within the assessed scope ~100% online under-trading recovery within existing portfolio in 12–24 months
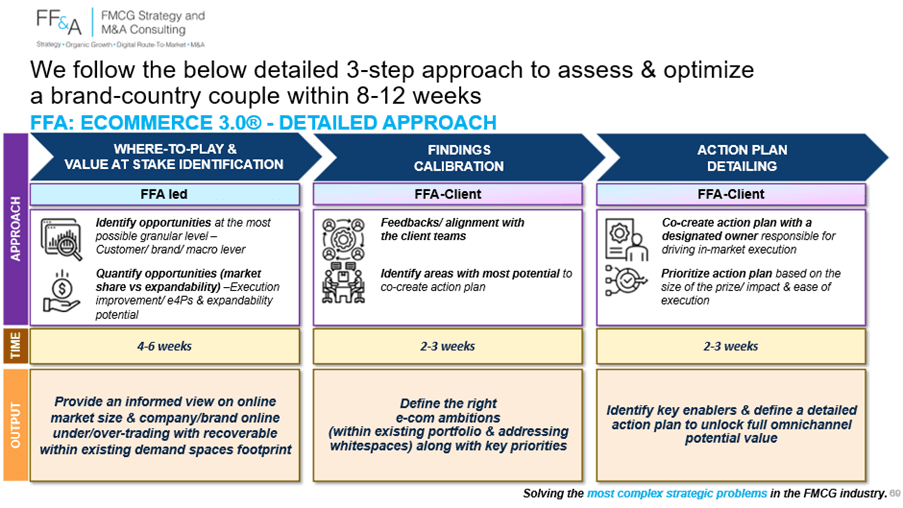
14. FF&A E-commerce 3.0® — Tested & Proven Across Verticals & Geographies
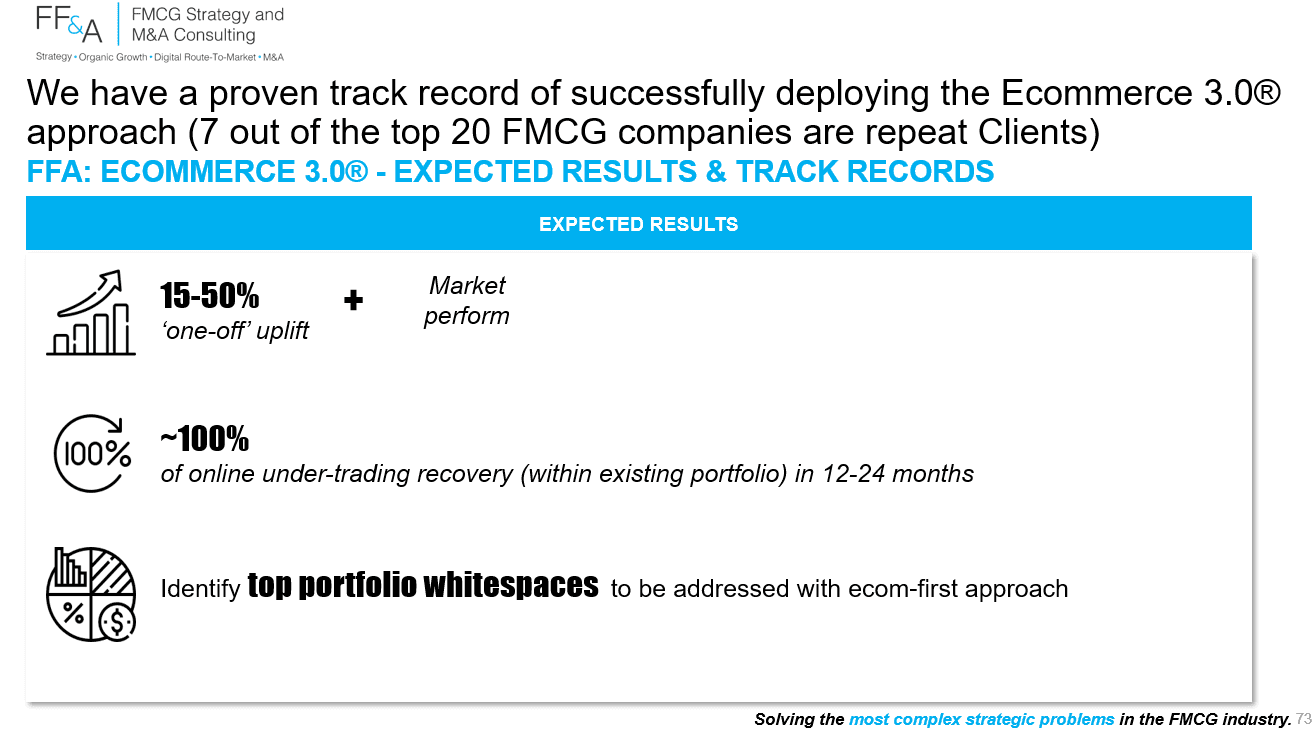
~35% of FF&A engagements are E-Commerce-related — deep, recurring expertise, not a side practice
Strong track records across all key FMCG verticals: F&B, BPC, CHC, Pet Care, Household
Deployed across all major geographies: North America, Europe, LatAm, China, SE Asia
First-hand experience strategizing e-commerce for 7 of the world's 20 largest FMCG companies
15. Free Debrief Call
If your company is among the above list — we are happy to walk you through the deck & your specific Value at Stake at country-brand level
What you get in the debrief: Your company's positioning on the FF&A E-Commerce IQ Index Your top bleeding country-category couples — sized in $m RSV A first view of the recovery path via FF&A E-Commerce 3.0®
Reach out to frederic@fredericfernandezassociates.com
The last decade in CHC e-commerce was about building foundations & playing catch-up on online weight. The 8 most-admired operators in the category invested heavily — yet every single one still under-trades, for a combined $5.3Bn bleed today widening to $8.3Bn by 2030.
The next decade will be about bringing high-ROI incremental omnichannel value — diagnosing the gap at country-brand level, pricing it in $m, & prescribing the recovery path on all 6 drivers of online performance, now AI-enabled.
This is our exciting challenge. Decisive times.
'While most people understand first-order effects, few deal with second- and third-order effects. Unfortunately, virtually everything interesting in business lies in fourth-order effects and beyond' - Jay W. Forrester (1918-2016, pioneering American computer engineer and systems scientist)
Get in touch:
To follow Frederic, please click Here. To start a conversation, email at: frederic@fredericfernandezassociates.com
To get the full deck of this publication, please write us at contact@fredericfernandezassociates.com
To subscribe to our newsletter and receive all our CEOs Insights, sign-up at the following link: FMCG CEOs: FMCG CEOs: Managing For Growth
About FF&A:
FF&A solves the most complex strategic problems of the world's largest FMCG companies across:
- Corporate Strategy
- Organic Growth (cf. our proprietary Zero-Based-Growth - https://lnkd.in/eWQEmcK3)
- Small Brands Growth (cf. our proprietary How Small Brands Grow - https://lnkd.in/eyp3Baq5)
- Digital RTM / Ecommerce (cf. our proprietary Ecommerce 2.0 - https://lnkd.in/e4-Q69Fi)
- M&A (cf. our proprietary Best Acquirers approach in FMCG - https://lnkd.in/gK7yj8Gm)
14 out of the top 20 world's largest FMCG companies are repeat Clients.
FF&A team intervenes all across the globe and across all FMCG categories. To know more, please visit our websites: www.fredericfernandezassociates.com | www.exponentialfmcg.com
No FF&A employees own any financial instruments on any FMCG companies or companies mentioned in the above article. All the above information are public information.
Enjoyed this article?

FMCG CEOs: Managing For Growth
Strategic insights for FMCG/ CPG CEOs