Corporate Strategy
More Fuel + Same Engine = Most Still Losing Share & Eroding Profitability Further - H1 2026 Results: Time for Zero-Based Growth®

Author | Managing Director & Partner @ FFA
'Every system is perfectly designed to get the results it gets' – Paul Batalden
To join up the 44k FMCG leaders receiving our newsletter: https://www.linkedin.com/newsletters/7045696201089785857/
The first half of 2026 is now in the books for the world's largest listed FMCG companies, and it answers the question Q1 left open. Was the inflection real? Yes. Was it enough? No.
Putting previous years in perspective,
2022-23: Pricing & supply chain disruption
2024: A transition year with negative volumes & a refocus on traditional growth tactics
2025: Made clear that the long-term growth algo was broken for most
Q1 2026: First signs of a turn, with the base effect doing most of the work
Catch up on where the year started in our Q1 2026 review: FMCG CEOs: Q1 2026 Results In Review – The End Of The Beginning?
H1 2026 confirmed the recovery and then showed its limits. Five things stand out:
• The recovery is real: organic sales growth accelerated to +3.9% from +2.8%, volume contributed +1.6% and was positive in four of five verticals. After thirteen quarters of price-led growth, H1'26 was volume-led. This is not a base effect anymore.
• And it was not enough: measured against the categories they actually compete in, 62% of top FMCGs grew below their own category (ie. lost market share). Consumer Health was worst at 83%, F&B 70%, BPC 67%, Household 64%. The only vertical ahead of its category, Alcoholic Drinks, is fishing in a pond growing 1.2%. Volume came back to the industry; share did not come back to most companies.
• Profit went backwards even though gross margin went forwards: 52% of the 48 FMCGs reporting EBIT saw profitability decline versus H1'25, and 63% still trade below pre-COVID margins six years on. Yet gross-margin expansion was broad-based, with 69% of the Top 36 expanding and the average up 49bps to 47.1%. The money was there.
• Everyone responded the same way, spend more: among the 11 companies that report A&P, 82% increased spend versus H1'25. More fuel went into the same growth models. Same engine, same result: most still losing share.
• In this context, most listed FMCG companies met their top-line consensus (70%), but most missed their EPS consensus (70%). An unsustainable algo
• Investments are flowing into exits and mega-deals, not into building: $46Bn of M&A on 32 deals, with 7 above $1Bn, but three transactions carry 74% of the value and KDP-JDE Peet's alone is half. On the other side, 25 completed divestitures in six months against 50 for the whole of 2025, and Unilever Foods to McCormick (~$45Bn, announced) is ~13x every completed divestiture of the half combined. Portfolio surgery has become the growth lever of choice precisely because organic growth failed.
The diagnosis is uncomfortable but simple. The constraint in H1 2026 was not investment. It was the engine. Which is why this edition spends more time than usual on Zero-Based Growth®, the new engine the world largest FMCG companies need to step-change their organic growth performance.
Read more about Zero-Based Growth®: FMCG CEOs: Managing Finally For Sustainable (Volume) Growth Or How To Stop Shrinking To Glory - From ZBB (Zero-Based-Budget) to ZBG® (Zero-Based-Growth)
As usual, here is how H1'26 panned out in 22 key messages/charts:
1) The recovery is real: OSG accelerated to +3.9% in H1'26, volume-led, with four of five verticals growing
• Organic sales growth reached +3.9% (vs +2.8% in H1'25), made of +1.6% volume and +2.3% price/mix
• F&B led at +4.9%, followed by BPC (+4.7%), Alc. Drinks (+3.2%) and Household (+2.3%)
• CHC was the only vertical to slow, from +1.3% to +1.2%
• Aggregate EBIT held at 17.9%, down 19bps vs H1'25

2) After thirteen quarters of price-led growth, FMCG has crossed over: volume at +1.6% in both Q1'26 and Q2'26
• Q2'26 delivered +1.6% volume and +2.3% pricing, in line with Q1'26 (+1.6% / +2.4%) and a world away from Q2'23 (-1.4% / +8.3%)
• Volume was positive in four of five verticals in Q2'26: BPC +4.6%, F&B +1.8%, Household +1.7%, Alc. Drinks +0.2%
• CHC is the exception, with Q2'26 volume still negative at -0.3%
• Even so, 33% of the 43 companies reporting a price/volume split saw volumes decline in Q2'26

3) H1'26 was volume-led across FMCG, but the leaders are a narrow group
• The Coca-Cola system, Unilever and Church & Dwight out-performed on volume; Perrigo and Ontex under-performed on both volume and value
• Coca-Cola İçecek (+32.5% price/mix, +8.3% volume) and Swire Coca-Cola (+11% volume, -1% price) are the outliers on each axis
• Unilever's CEO called it 'the best quarter in terms of volume growth in more than 15 years'

4) Q2'26 consensus: the top line held, the bottom line slipped
• 30% of the world's largest listed FMCGs missed revenue consensus in Q2'26, up from 22% in Q1'26 but still well below Q2'25's 58%
• 70% missed EPS consensus, versus 29% in Q1'26, back in the 63-68% range seen through FY'25
• Revenue gains held but stopped widening; profit delivery went backwards

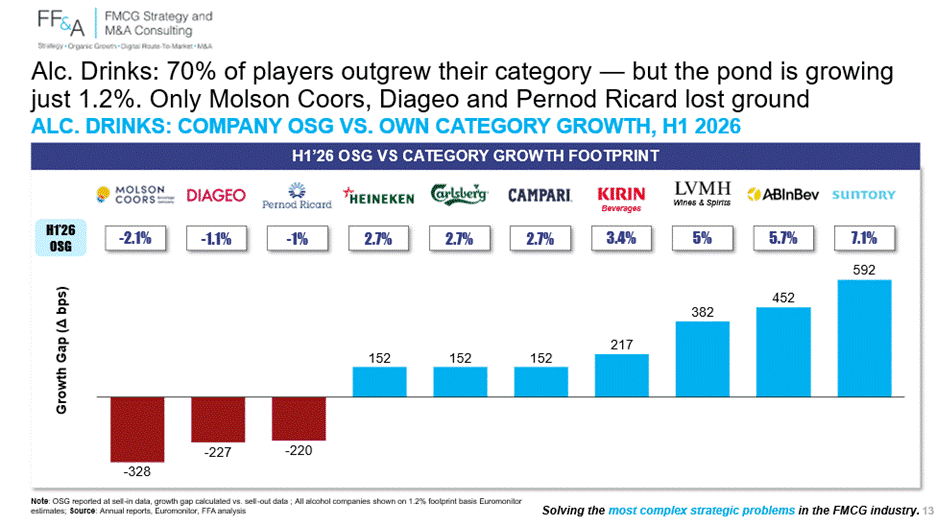
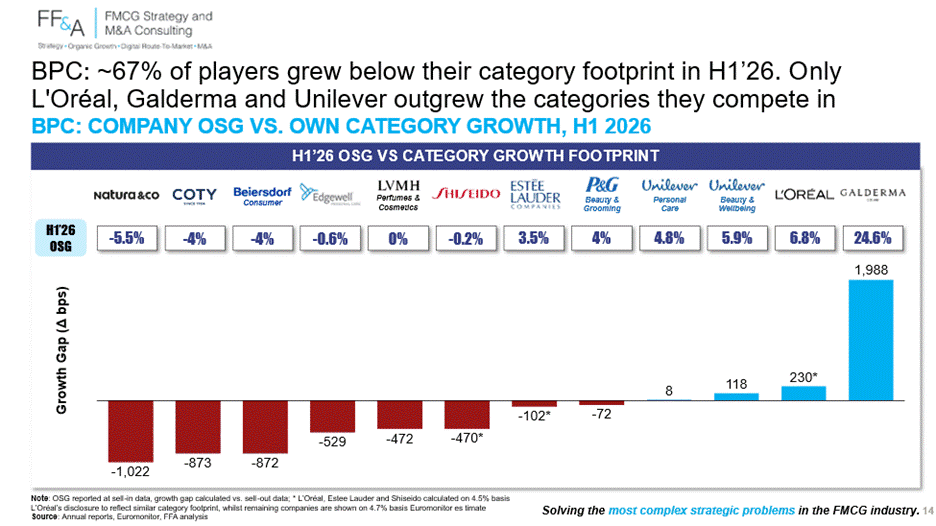
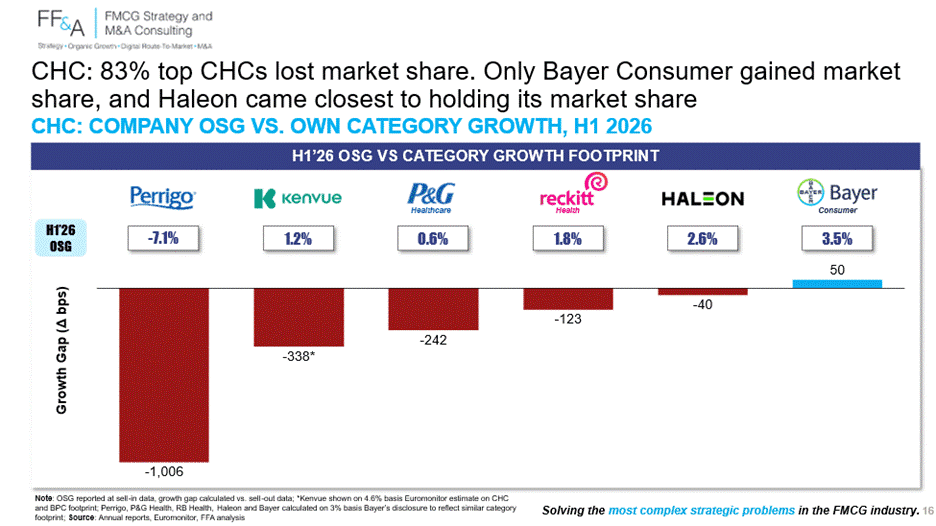
5) Measured against their own categories, 62% of top FMCGs lost share in H1'26
• 34 of 55 businesses grew below the category footprint they compete in
• CHC worst at 83%, F&B 70%, BPC 67%, Household 64%
• Alc. Drinks is the only vertical where most players outgrew their category (70%), against a category growing just 1.2%
• Category growth used as the yardstick: F&B +5.2%, BPC +4.7%, Household +3.2%, CHC +3.0%, Alc. Drinks +1.2%

6) The growth gap by vertical: who is actually taking share
• F&B: ~70% of players grew below their category. Coca-Cola, Grupo Bimbo, Keurig Dr Pepper, Lindt and Mondelez outgrew theirs
• Alc. Drinks: 70% outgrew a category growing 1.2%. Only Molson Coors, Diageo and Pernod Ricard lost ground
• BPC: ~67% grew below category. Only L'Oréal, Galderma and Unilever outgrew the categories they compete in
• Household: ~64% grew below category. Unilever Home Care, Church & Dwight, Reckitt and Kao outperformed
• CHC: 83% lost share. Only Bayer Consumer gained; Haleon came closest to holding


7) Profitability recovery remains elusive: 52% of the top 48 saw EBIT decline, 63% still below pre-COVID
• 52% of the 48 FMCGs reporting EBIT at H1 saw margins decline vs H1'25
• 63% still trade below 2019 margin levels, six years on
• Coca-Cola Company (35% EBIT, +710bps vs 2019), Grupo Bimbo (+614bps) and Kirin Beverages (+379bps) sit furthest above pre-COVID; only Coca-Cola and Kirin also grew vs H1'25
• Molson Coors (-1,270bps), LVMH Wines & Spirits (-860bps), Kraft Heinz (-720bps) and Coty (-714bps) sit furthest below

8) Everyone responded the same way: spend more
• Among the 11 companies that report A&P, ~82% increased spend vs H1'25; the average rose 35bps
• Campari (+80bps), Colgate-Palmolive (+71bps), L'Oréal (+63bps) and Unilever (+60bps) raised spend most; Kirin (-44bps) and Ontex (-23bps) cut
• Yet only 43% of those with a 2019 baseline are now spending above pre-COVID levels: Colgate (+334bps), Unilever (+210bps) and L'Oréal (+176bps) are above; Church & Dwight (-164bps) is well below

9) The money was there: gross-margin expansion was broad-based
• 69% of the Top 36 FMCGs expanded gross margin, lifting the average 49bps to 47.1%
• Shiseido (79%), L'Oréal (75%) and Galderma (70%) lead on absolute gross margin
• Mondelez (+560bps) posted the largest gain; Keurig Dr Pepper (-861bps) the largest decline
• Fuel was not the constraint in H1 2026

10) The engine, not the fuel: Zero-Based Growth® in three layers
• Diagnosis: the constraint in H1 2026 was not capital. Gross margin expanded at 69% of the cohort and A&P rose at 82% of disclosers, yet 62% of companies grew below their own category. More spend went into the same growth models, spread evenly across every cell and every lever

• The Cell 10/80: ~10% of brand-country cells carry ~80% of the value at stake
• The Consumer 10/80: ~20-25% of consumers carry ~65-70% of RSV and ~80-90% of shelf growth. Mass-reach spend goes to the rest, and a point of penetration on the most engaged consumers is worth ~8x a point on the least engaged
• The Lever 10/80: within each prioritised cell, ~10% of growth levers deliver ~80% of the upside, across the full 4Ps


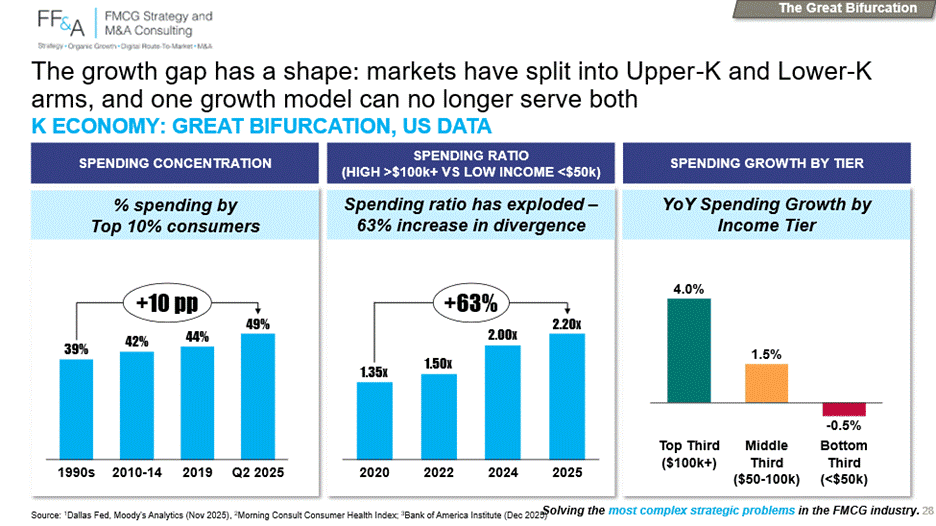
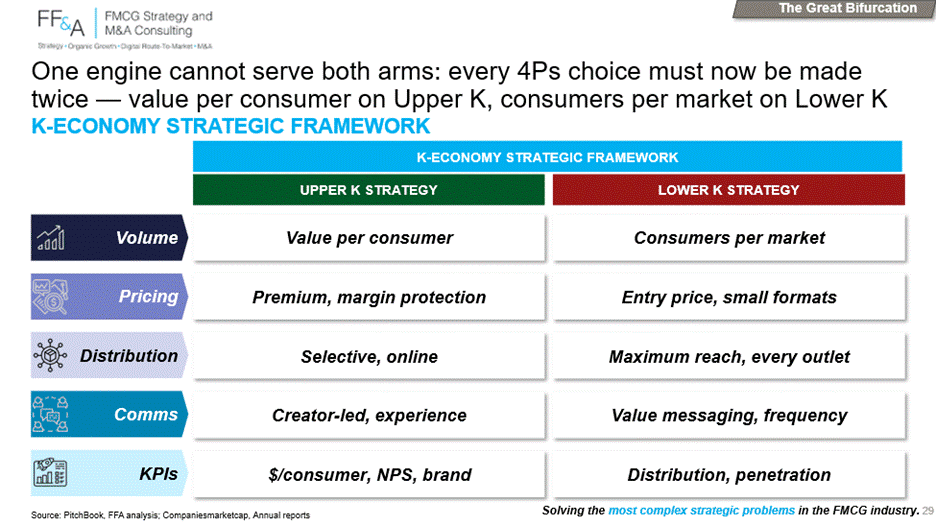
• The Great Bifurcation: markets have split into Upper-K and Lower-K arms, and one growth model can no longer serve both. Every 4Ps choice must now be made twice: value per consumer on Upper K, consumers per market on Lower K
• No one-size-fits-all: ZBG® adapts by situation, from Emerging Markets (~1,000bps, ~2x the overall average) to e-commerce-first brands (50-80% growth within 6 months) and DTC turnarounds (100-150% in 24 months)

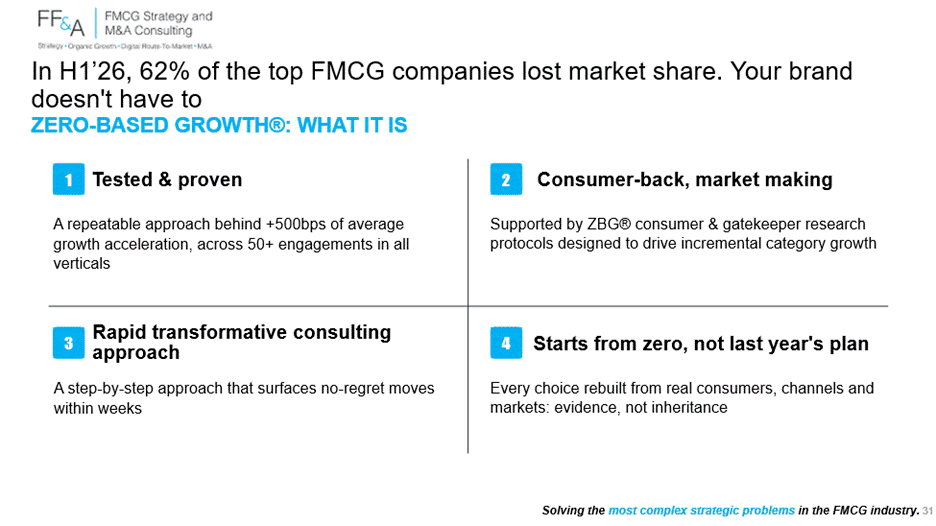
• Tested & proven: +500bps of average growth acceleration across 50+ engagements in all verticals. The ZBG® Sprint now puts the full methodology in your brand team's hands: ~6 hours of video, 40+ frameworks, 5 seats and 12 months of bi-weekly coaching with Frédéric and the FF&A team

Ready to change the engine? Three ways to start:
>> Explore the ZBG® Sprint — click here
>> Book a 15-minute call with Frédéric — click here
>> View all ZBG® packages and find the right entry point for your team — click here
11) Investments are flowing into exits and mega-deals, not into building
• M&A rebounded to $46Bn on 32 deals, with 7 transactions above $1Bn vs 3 in H1'25 and 2 in H1'24. Average disclosed deal size more than doubled to $2,704m from $1,183m
• But the recovery is one transaction deep: Keurig Dr Pepper-JDE Peet's ($22.9Bn) alone is half the value, and with L'Oréal's Galderma stake ($6.3Bn) and Kering Beauty ($4.6Bn), three deals carry 74%
• F&B led with 14 deals for $27.5Bn, followed by BPC (7 deals, $11Bn), Alc. Drinks (5 deals, $3.6Bn), Household (2 deals, $2.6Bn) and CHC (4 deals, $1.3Bn)
• 25 divestitures completed in H1'26 across all six verticals for $3.5Bn of disclosed value: 25 deals in six months against 50 for the whole of 2025
• The scale sits in what is announced, not closed: Unilever Foods to McCormick (~$45Bn) is ~13x every completed divestiture of the half combined


Read more about the defining transaction of this exit cycle, Unilever Foods x McCormick, decoded in 10 Key Messages: The Deal The Market Got Wrong? Unilever Foods x McCormick In 10 Key Messages
12) FMCG market cap recovered ~11%, still behind the S&P 500, and bifurcating within every vertical
• Combined market cap of the 51 largest listed FMCGs reached ~$2.79Trn in Aug'26, +11% since Jan'25 vs +12% for the S&P 500; ~43% of companies lost market cap over the period
• Out-performers: Coca-Cola (+45%, +$121Bn), AB InBev (+56%, +$55Bn), L'Oréal (+26%, +$49Bn), Nestlé (+20%, +$42Bn), Galderma (+90%, +$24Bn)
• Under-performers: P&G (-15%, -$59Bn), Diageo (-27%, -$19Bn), PepsiCo and General Mills (-$14Bn each), Beiersdorf (-31%), Pernod Ricard (-30%), Kimberly-Clark (-17%)
• The divide runs inside each vertical: Coca-Cola vs PepsiCo in F&B, AB InBev vs Diageo in Alc. Drinks, L'Oréal vs Coty (-56%) in BPC, Kao vs Clorox (-35%) in Household


13) F&B: growth held at +4.9%, with beverages accelerating and US-centric food still bleeding volume
• F&B organic growth of +4.9% (vs +4.6% H1'25) on $270Bn of net revenue, made of +2.0% volume and +2.9% price/mix
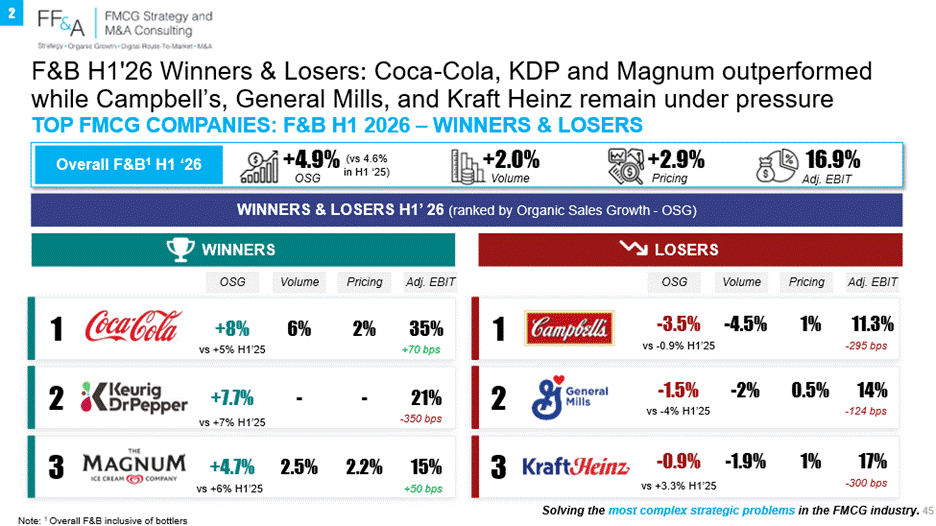
• Coca-Cola (+8%), Keurig Dr Pepper (+7.7%) and Magnum Ice Cream (+4.7%) lead; Campbell's (-3.5%), General Mills (-1.5%) and Kraft Heinz (-0.9%) remain under pressure
• Kraft Heinz, General Mills, Campbell's and Conagra continue to bleed volume; Lindt is the outlier with +11.8% pricing on -7.5% volume
• EBIT at 16.9%, down 45bps vs H1'25


14) KO Bottlers remain the standout system in FMCG: +12.9% OSG, +500bps YoY
• Volume at +5.8%, nearly 3x the F&B average of +2.0%, alongside pricing of +7.1%, on $45Bn of net revenue
• Coca-Cola İçecek (+40.8% vs +22.4%), Coke Consolidated (+13.5% vs +1.4%) and Swire Beverages (+10%) lead; all seven bottlers grew on both volume and value
• EBIT at 14.7%, up 73bps vs H1'25 and up 317bps vs 2019, against +1bps for F&B overall


15) Alc. Drinks rebounded on price, and the beer-versus-spirits gap keeps widening
• OSG more than tripled to +3.2% (vs +0.9% H1'25), but +2.6% of it is price/mix against only +0.6% volume
• Winners: Suntory +7.1%, AB InBev +5.7%, Heineken and Carlsberg both +2.7%; LVMH Wines & Spirits +5% and Kirin +3.4% also grew
• Losers: Diageo (-1.1%) and Pernod Ricard (-1%); In Beer: Molson Coors (-2.1%)
• EBIT recovered +42bps to 19.3% but remains -318bps below 2019


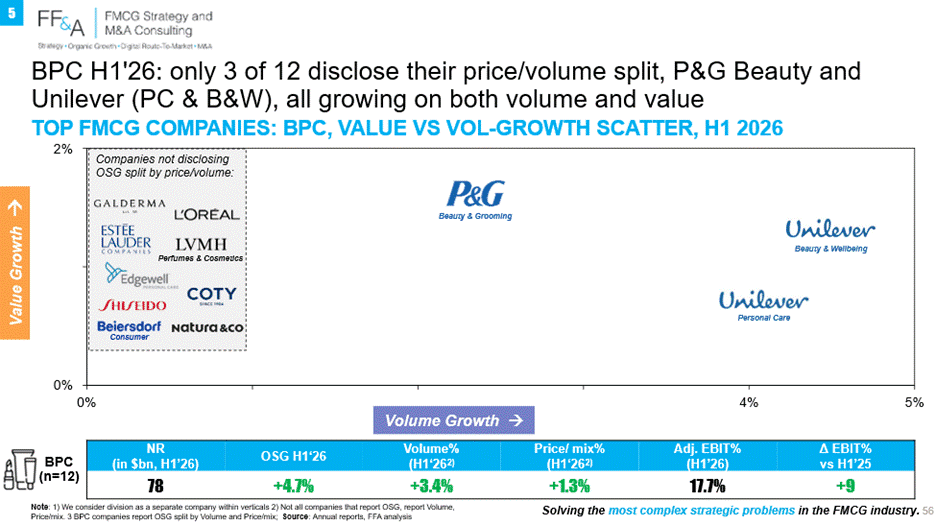
16) BPC is the most volume-led vertical and the most brutally divided
• OSG accelerated to +4.7% (vs +1.6% H1'25) on +3.4% volume and just +1.3% price/mix
• Galderma (+24.6%), L'Oréal (+6.8%) and Unilever Beauty & Wellbeing (+5.9%) on one side
• Natura (-5.5%), Coty (-4%) and Beiersdorf Consumer (-4%) on the other: a 30-point spread inside one vertical
• EBIT held at 17.7% (+9bps); only 3 of 12 players disclose their price/volume split


17) Household is the cleanest recovery in FMCG: growth accelerated on volume, with almost no pricing
• OSG accelerated to +2.3% (vs +1.2% H1'25), of which +2.0% is volume and only +0.3% price/mix
• Unilever Home Care (+7.6%, volume +7.4%), Church & Dwight (+5.6%) and Kao Consumer (+4.1%) lead a broad-based recovery
• Clorox (-7.5%) and Ontex (-2.2%) are the only two companies declining
• EBIT at 17.8%, down 46bps vs H1'25


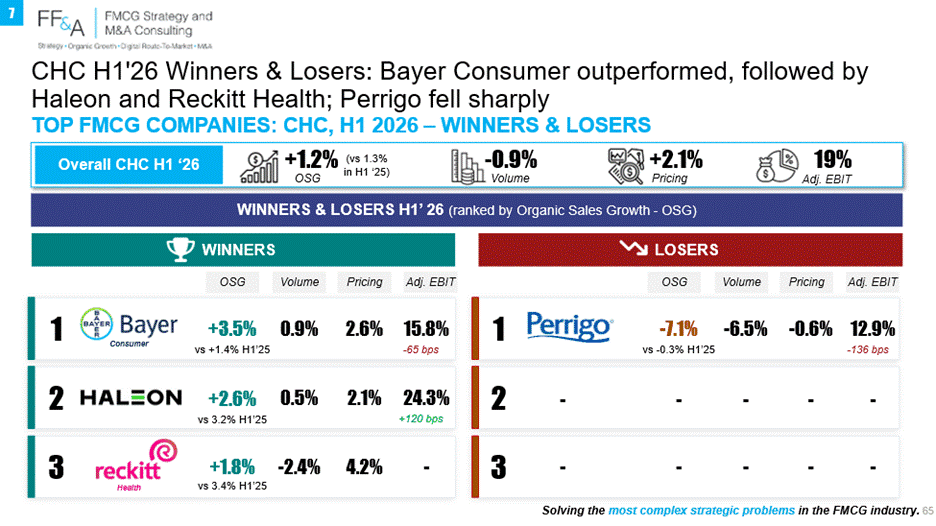
18) CHC: the only vertical with declining volume, growth entirely price-led
• OSG slowed to +1.2% (vs +1.3% H1'25): +2.1% price/mix against -0.9% volume
• Bayer Consumer (+3.5%) and Kenvue (+1.2%) are the lone accelerators; Haleon (+2.6%) and Reckitt Health (+1.8%) follow
• P&G Healthcare (-2.5%) and Reckitt Health (-2.4%) both lost volume; Perrigo collapsed to -7.1% on -6.5% volume
• EBIT at 19.2%, up 45bps vs H1'25


19) The Next-Gen FMCG playbook is deflating
• Aggregate net revenue growth of +8% in H1'26, down from +24% in H1'25; adj. EBITDA at 7.1%, down 159bps
• e.l.f. Beauty accelerated from +6% to +36% and remains the standout; Nykaa +28%, Hims & Hers slowed from +90% to +20%
• Two of the seven are declining: HelloFresh (-8%) and Beyond Meat (-12%)
• Combined market cap down 30% since Jan'25, with HelloFresh -79%

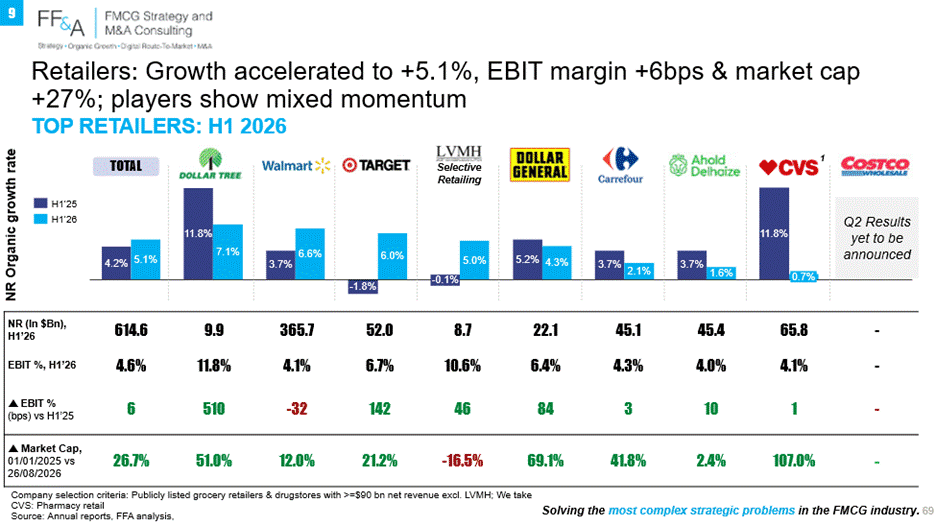
20) Retailers: growth resilient at +5.1%, margins improving across most players
• Net revenue growth of +5.1% on $615Bn, with EBIT at 4.6%, up 6bps vs H1'25
• US mass accelerated: Walmart +6.6%, Target +6.0%, Dollar General +4.3%; Dollar Tree slowed to +7.1% from +11.8%
• EU grocers slowed: Carrefour +2.1%, Ahold Delhaize +1.6%; CVS retail pharmacy slowed sharply from +11.8% to +0.7%; LVMH Selective Retailing grew +5.0%
• Retailer market caps rose 26.7% since Jan'25, materially ahead of FMCG manufacturers (~11%)
21) Hyperscalers: growth slowed and margins compressed, except at Amazon and JD
• Aggregate growth at +12%, down from +13.3%, with EBIT at 7.2%, down 77bps, on $479Bn of net revenue
• MercadoLibre grew +50% but lost 573bps of EBIT on free-shipping costs and bad debt; market cap -9%
• Amazon (ex-AWS) grew +14.8% and gained 76bps to 6.8%, helped by ~$600m of tariff refunds; market cap +23% on AWS and its Anthropic stake
• Alibaba slowed to +6.2% and lost 685bps of EBIT on the quick-commerce subsidy war, AI Labs losses and EU fines; market cap +41% on its re-rating from retailer to AI platform
• JD.com declined -1.7% as electronics fell -12% against 2025's subsidy-driven base; market cap -22%

22) What H1 2026 showed, and the next step
• The constraint was not capital: gross margin expanded at 69% of the cohort and A&P rose at 82% of disclosers, yet 62% grew below their own category
• Zero-Based Growth® in three layers: the Cell 10/80, the Consumer 10/80 and the Lever 10/80
• Across 100+ ZBG® engagements, the <10% of levers carrying ~80% of the value at stake have been identified at brand and channel level in every case
'The essence of strategy is choosing what not to do' – Michael Porter

Bringing it all together: H1'26 confirmed the recovery Q1 promised, and then showed what it was worth.
Volume is back at +1.6%, organic growth is at +3.9%, gross margins expanded almost everywhere, and 82% of companies put more money behind their brands. By every input measure, the industry did what it said it would do.
By the only output measure that matters, most of it did not work. 62% lost market share. 52% lost EBIT margin. 70% missed EPS in Q2. The money was there; the engine was not new.
The M&A market has reached the same conclusion from the other direction. $46Bn of acquisitions concentrated in three deals, 25 completed exits in six months, and a ~$45Bn divestiture waiting to close: investments are flowing into buying and selling growth because organic growth is not delivering it.
Reality is that H1'26 gave FMCG CEOs the recovery they asked for, and the hard part starts now. More fuel in the same engine will produce the same result. Same cells, same levers, more spend, most still losing share.
The engine has to change — Time to manage for growth,
Exciting times
Frederic
Get in touch:
To join the ~73k FMCG executives that follow Frederic on LinkedIn, please click here. To start a conversation, email at: frederic@fredericfernandezassociates.com
To join the ~44k FMCG executives that receive our newsletter and all our CEOs Insights, sign-up at the following link: FMCG CEOs - Managing For Growth
To read all our previous publications, visit our newsletter page: FMCG CEOs - Managing For Growth
About FF&A:
FF&A solves the most complex strategic problems of the world largest FMCG companies across with proprietary approaches developed along with our Clients over the last decade:
Corporate Strategy (Zero-Based-Strategy®)
Organic Growth (Zero-Based-Growth®)
Digital RTM (Ecommerce, DTC and EB2B) (Ecommerce 2.0®)
M&A (Best Acquirers®)
14 out of the world 20 largest FMCG companies are repeat Clients. FF&A team intervenes all across the globe and across all FMCG categories.
To know more, please visit our website: www.fredericfernandezassociates.com
Disclaimers:
No FF&A employees own any stocks or financial instruments of any FMCG companies or companies mentioned in the above article. All the above information are public information
Enjoyed this article?

FMCG CEOs: Managing For Growth
Strategic insights for FMCG/ CPG CEOs