
Digital Route-To-Market
FMCG CEOs: Bridging The ~$12Bn Ecommerce Gap On Beauty Personal Care (BPC) - The FF&A Ecom IQ Index® Report

Author | Managing Director & Partner @ FFA
'See reality as it is, not as you wish it to be' - Jack Welch
To join the >42,000 FMCG executives that receive automatically all our FMCG CEOs Insights (publications like this one), sign-up to our newsletter at the following link: FMCG CEOs: Managing For Growth
Time has come to stop the BS about Ecommerce indexes & rankings. There are too many out there (BCG, McK, Gartner L2, DCI, Flywheel, Profitero...) focusing on declarative, superficial, piecemeal and at such non-predictive metrics.
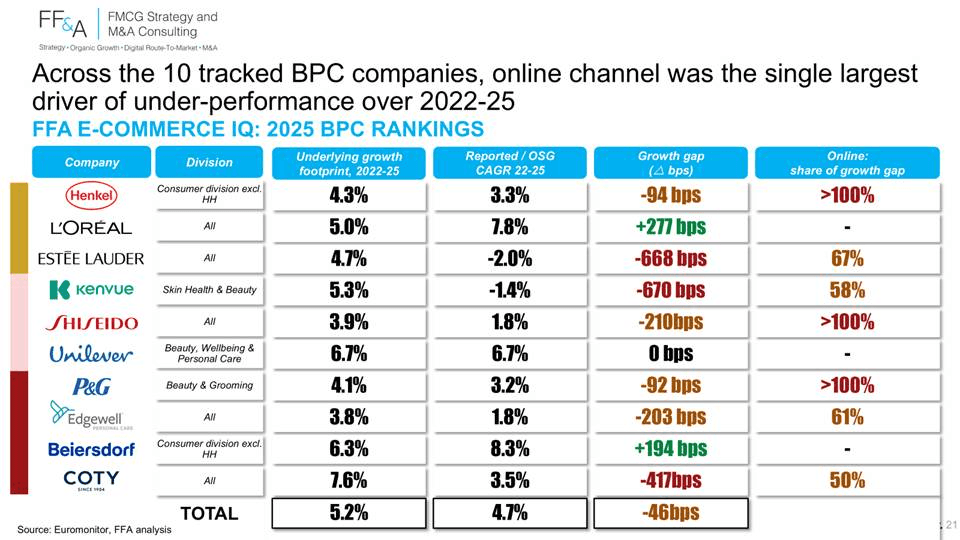
We stopped counting the celebratory trackers making everyone feeling good whereas most FMCG companies are bleeding market share online. To the point that it has often become the #1 driver of their omnichannel market share decline.
We are now introducing FF&A E-Commerce IQ® & E-Commerce 3.0® — the only holistic approach that diagnoses, prices & predicts e-commerce performance
• Existing e-commerce indexes stop at symptoms — self-reported maturity surveys or digital shelf hygiene scorecards; none financially anchored, none predictive of online market share
• FF&A E-Commerce IQ prices the gap between online and offline market share leveraging Euromonitor data and reconciling it with publicly available data (and there are many on BPC)
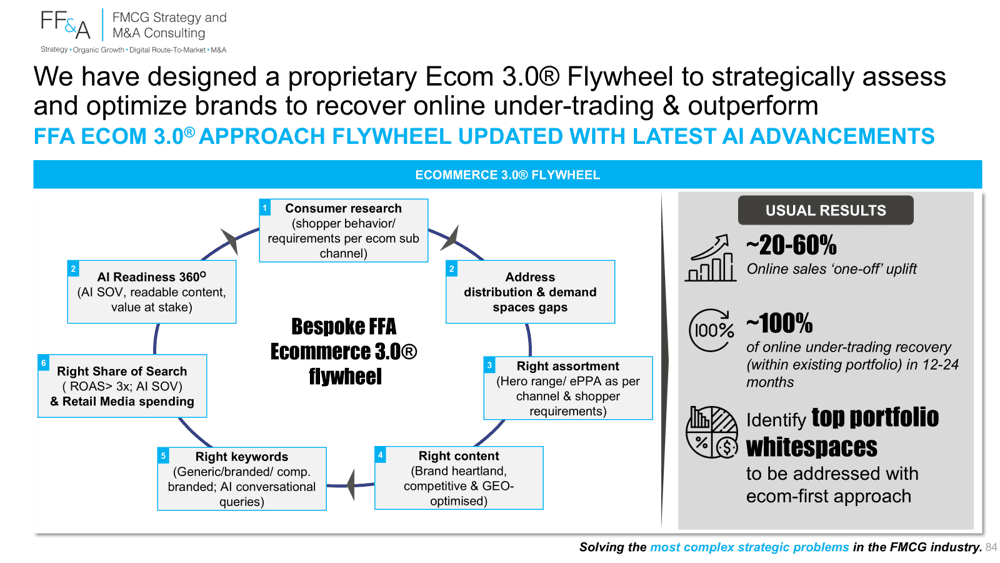
• FF&A E-Commerce 3.0® flywheel translates diagnosis into action — acting on all 6 drivers of online performance, now AI-enabled
• Proven engagement track record with the world largest FMCG companies — ~20–60% online sales uplift & ~100% under-trading recovery in 12–24 months
After CHC, we now continue our FF&A Ecom IQ Index® coverage on Beauty Personal Care (BPC). Pet Care will follow in the next weeks.
Over the last decade & especially since COVID-19, e-commerce has become a must-win battle across all FMCG verticals — and Beauty Personal Care (BPC) is no exception. Unprecedented resources were poured into digital teams, retail media, and sometimes large acquisitions, enabling most BPC players to approach their online 'fair share'.
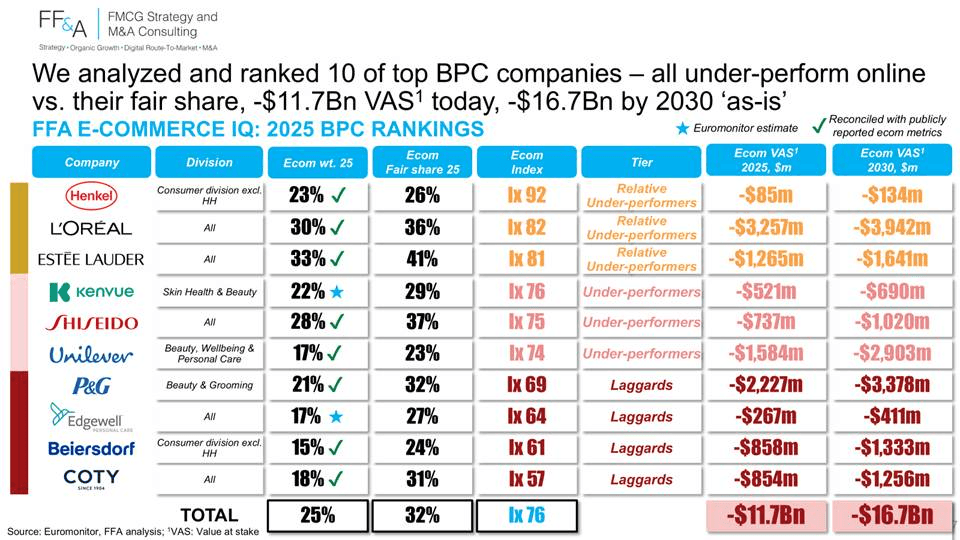
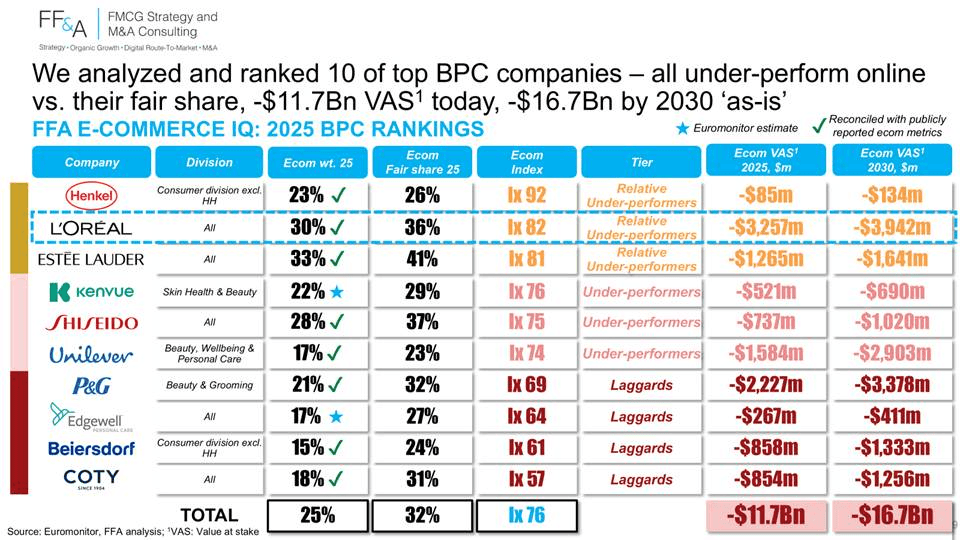
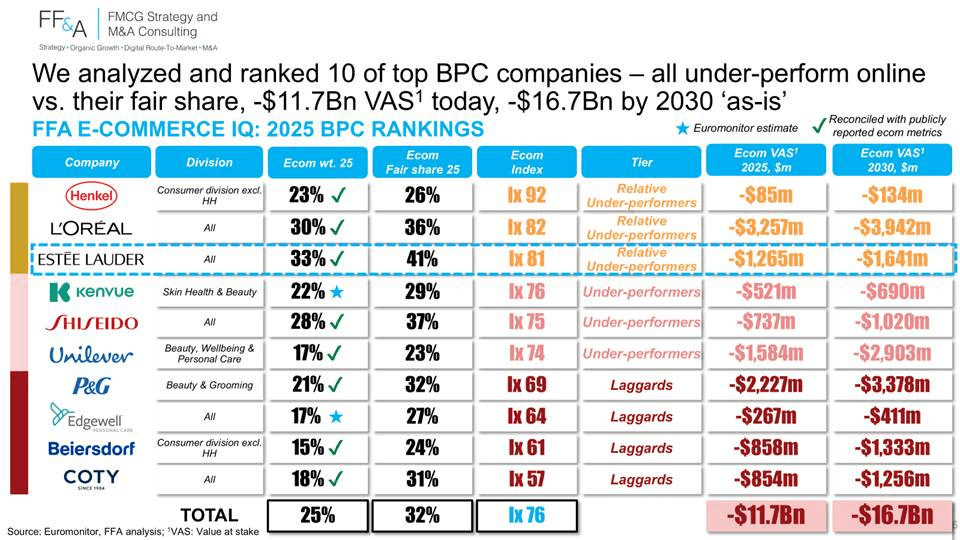
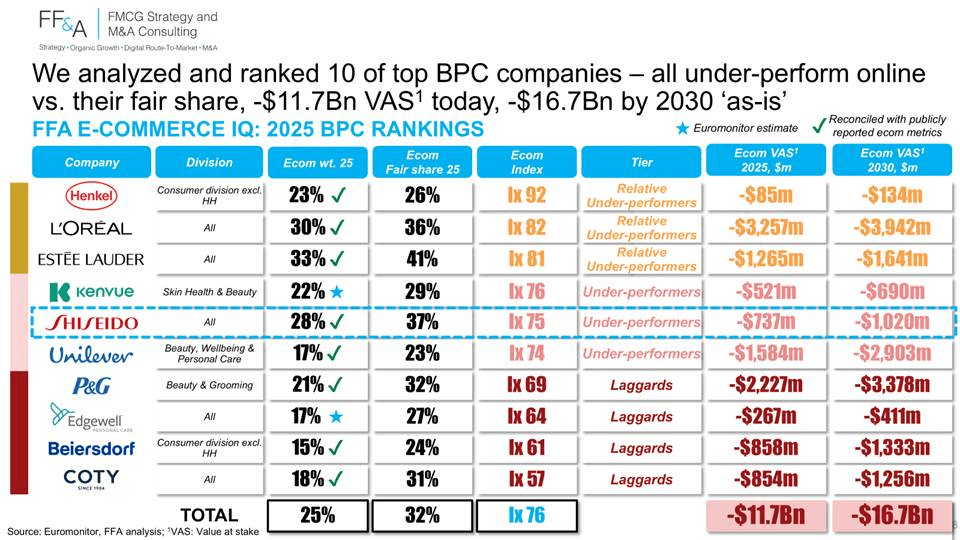
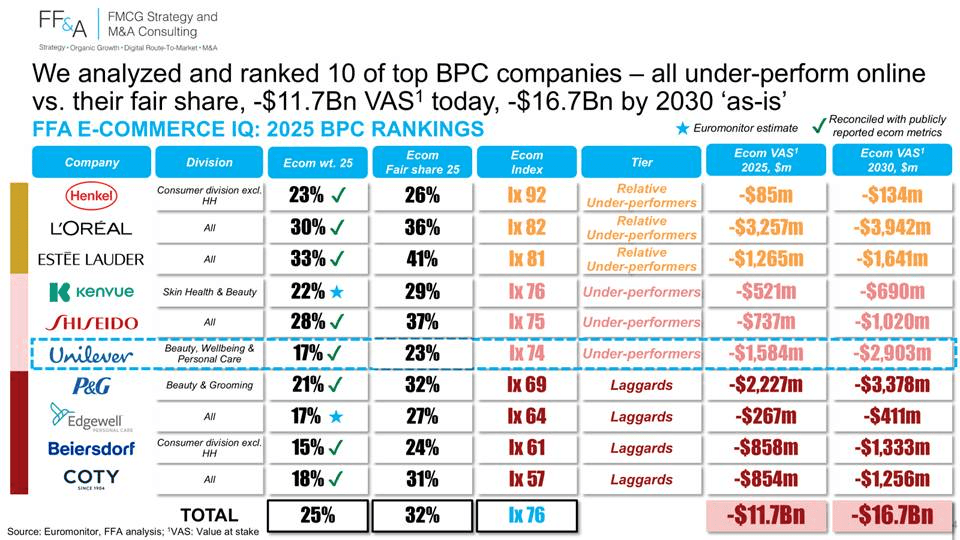
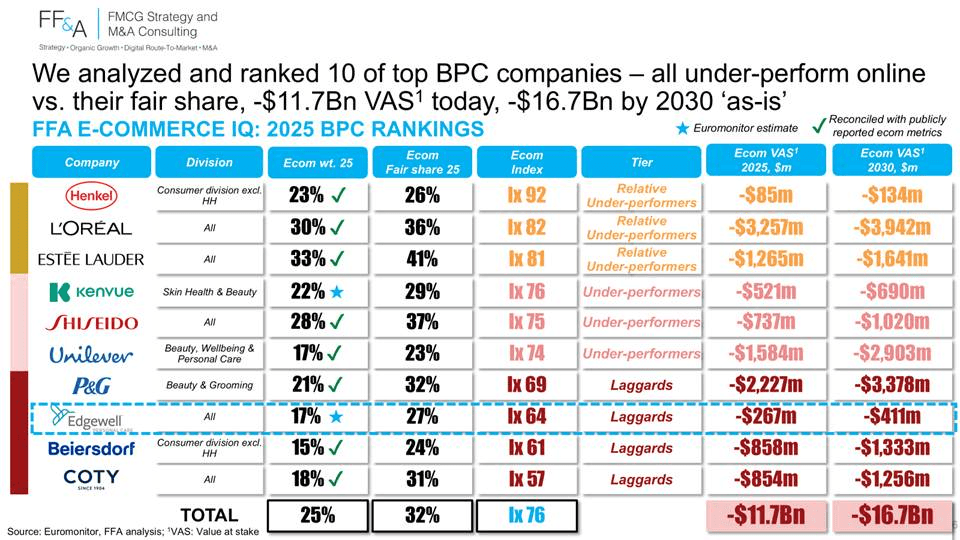
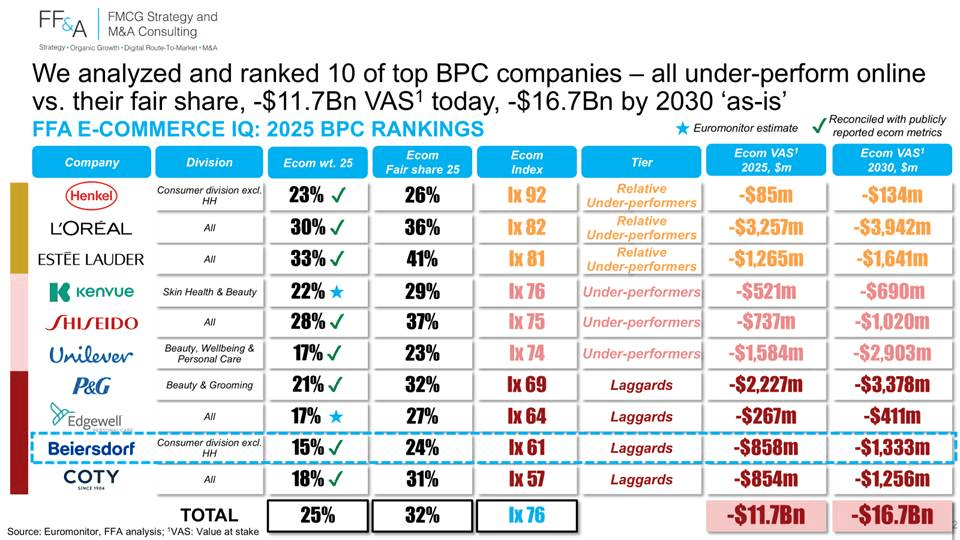
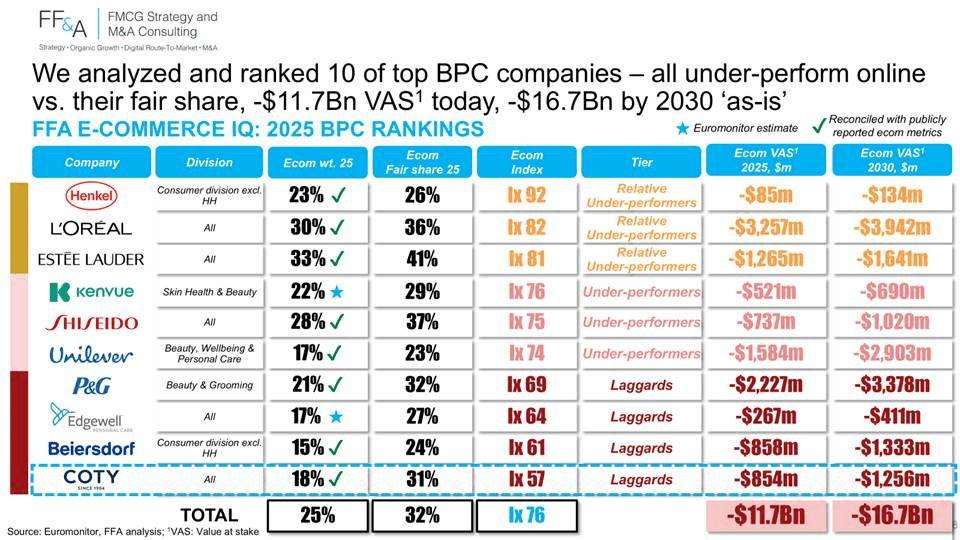
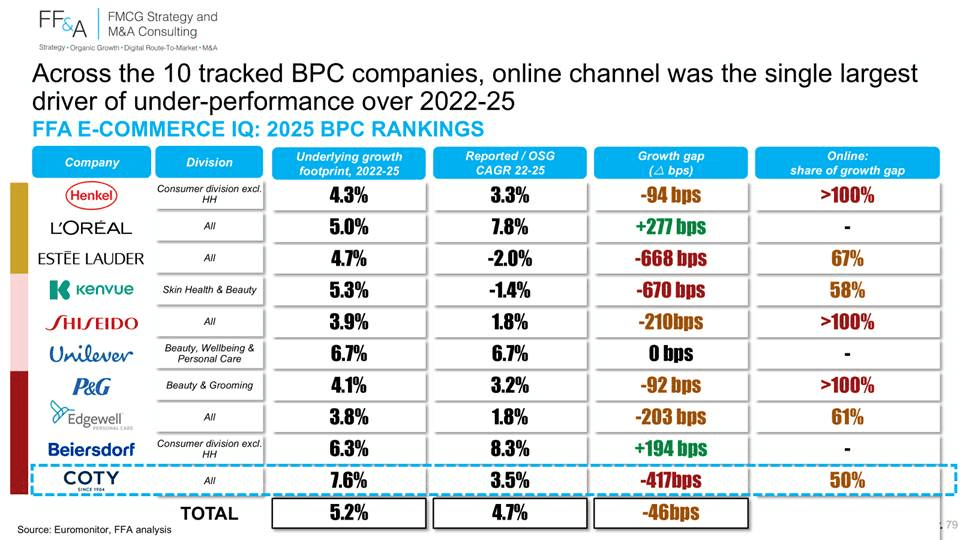
A decade in, the picture is sobering. Across the top 10 global BPC players/ divisions, every single one is under-trading online, for a combined value-at-stake of ~$12Bn RSV in 2025, predicted to widen 'as-is' to ~$17Bn by 2030.
All details below
1) Introducing FF&A E-Commerce IQ + 3.0® — The Only "Diagnose, Price, Predict" Approach in the Market
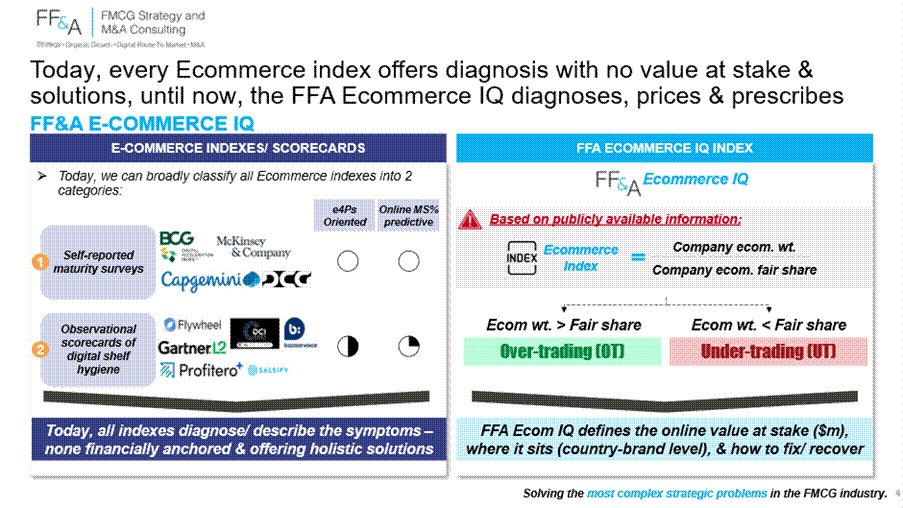
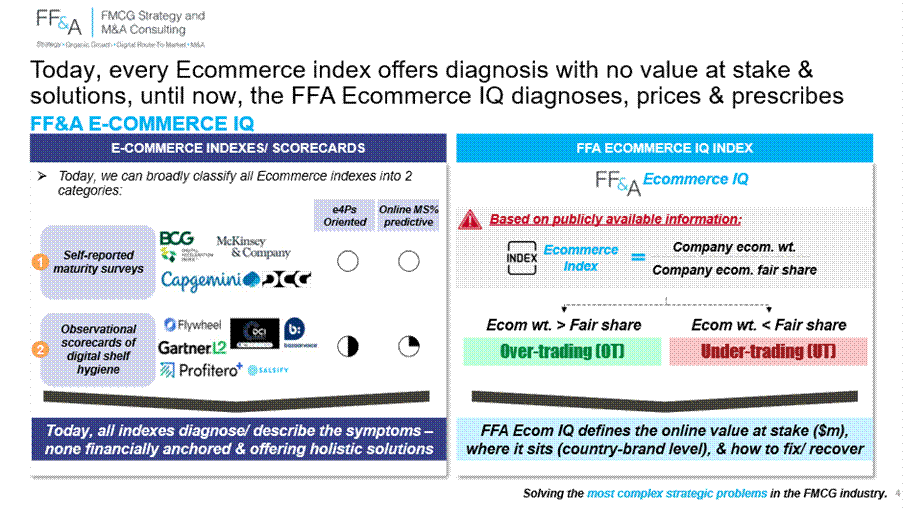
Our proprietary FF&A E-Commerce IQ — is the only e-commerce index in the market that prices the value at stake in $m at country-brand level & prescribes the recovery path.
a) Today's e-commerce indexes stop at the symptoms. Existing indexes fall into one of two camps: (i) self-reported maturity surveys (e4Ps-oriented), or (ii) observational scorecards of digital shelf hygiene (content, ratings, search visibility). None financially anchored at country-brand level. None predictive of online market share. None offering a holistic recovery path.
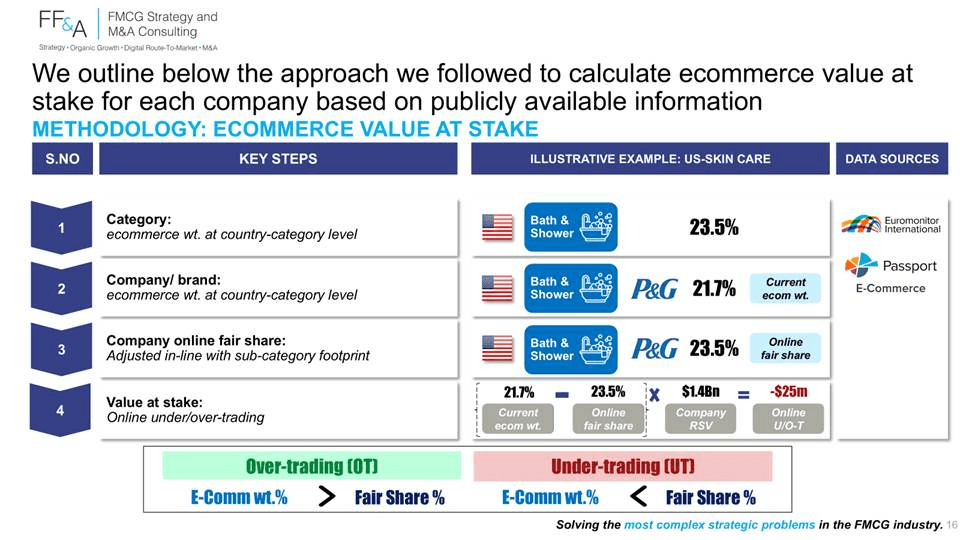
b) FF&A E-Commerce IQ closes that gap. We benchmark each company's actual online weight against its estimated online fair share — adjusted for sub-category footprint — & price the delta in $m RSV at country-brand level:
Index = E-comm wt. ÷ Fair share × 100
Index <100 → online under-trading (value bleeding through the digital shelf)
Index >100 → online over-trading (company outperforming its fair share online)
Gap sized as Online Value at Stake ($m RSV) — financially anchored, online MS%-predictive, actionable
•
c) From diagnosis to prescription — the Ecommerce 3.0® flywheel.
Identifying the gap is half the work. Recovery requires acting on all six drivers of online performance — what we call the FF&A Ecommerce 3.0® flywheel:
✓ Consumer research — shopper behaviour & requirements per e-comm sub-channel
✓ Distribution & demand space gaps — closing white spaces in coverage
✓ Right assortment — hero range / ePPA per channel & shopper
✓ Right content — brand heartland, competitive, GEO-optimised
✓ Right keywords — generic, branded, competitor-branded, AI conversational queries
✓ Right Share of Search + Retail Media (ROAS >3x, AI SOV) + AI Readiness 360°
d) Proven results. Across BPC & adjacent verticals, FF&A E-Commerce 3.0® has consistently delivered:
• ~20–60% ‘one-off’ online sales uplift within the assessed scope and,
• ~100% online under-trading recovery within existing portfolio in 12–24 months.
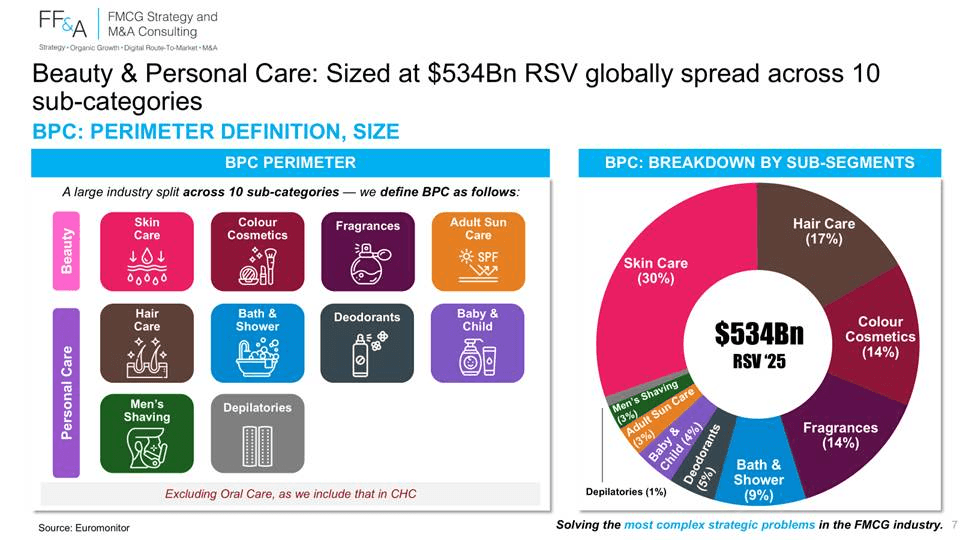
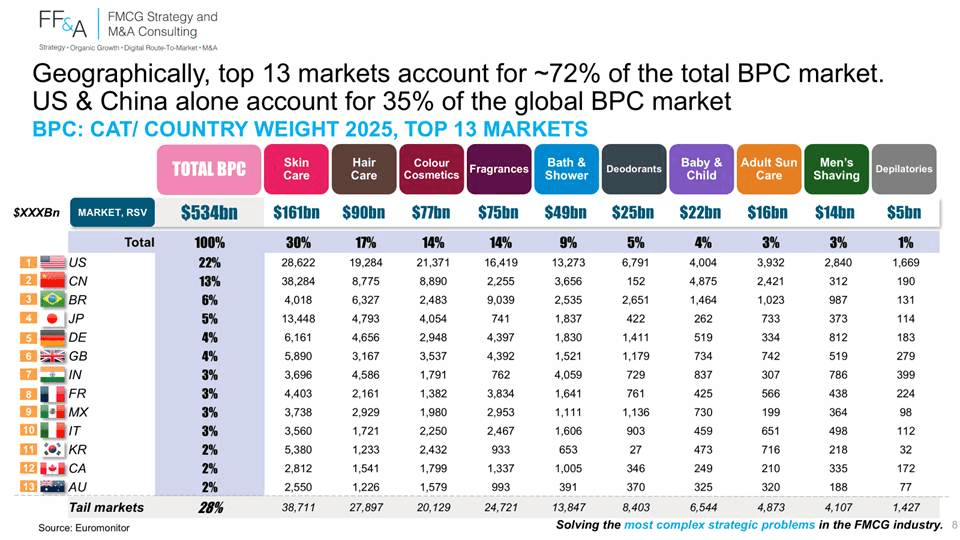
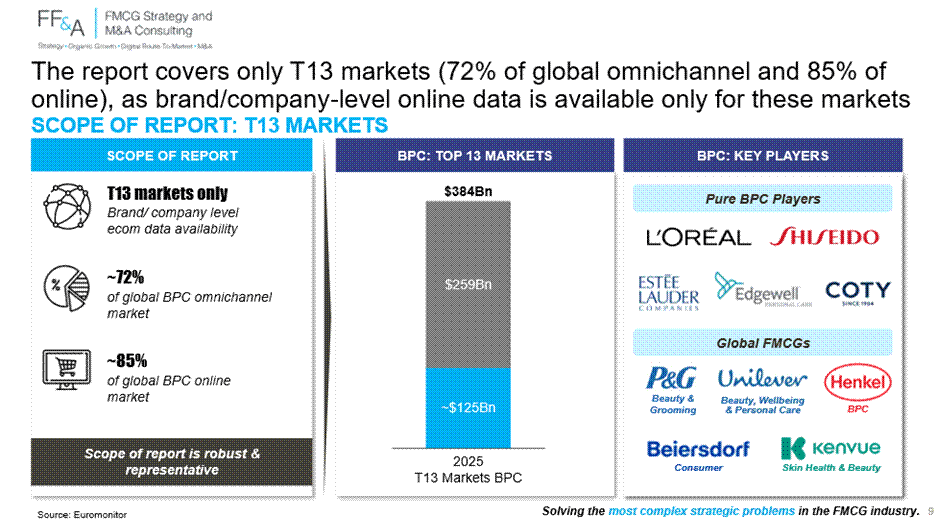
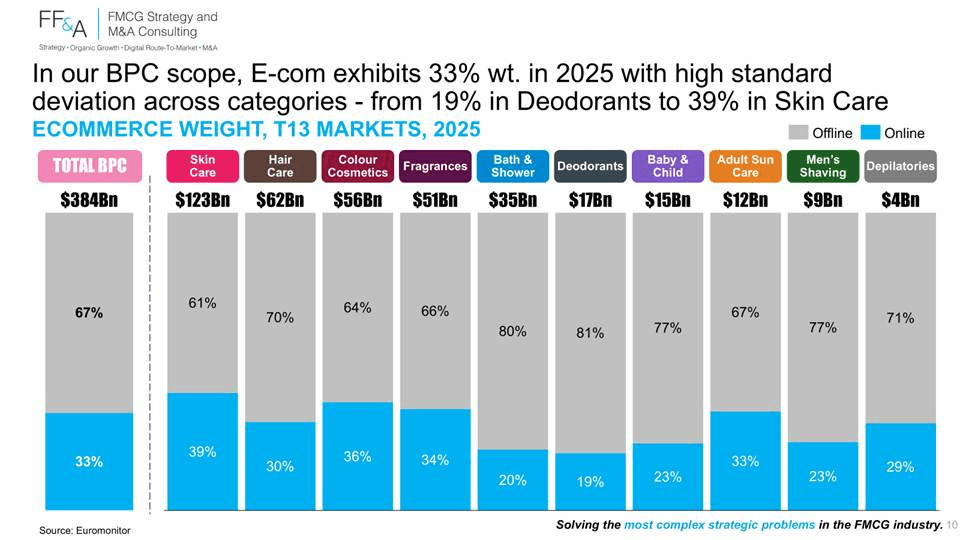
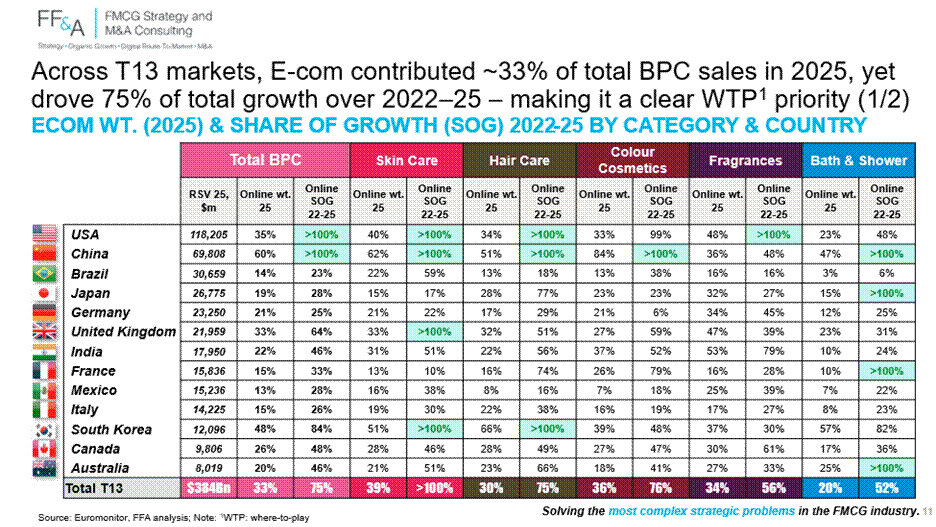
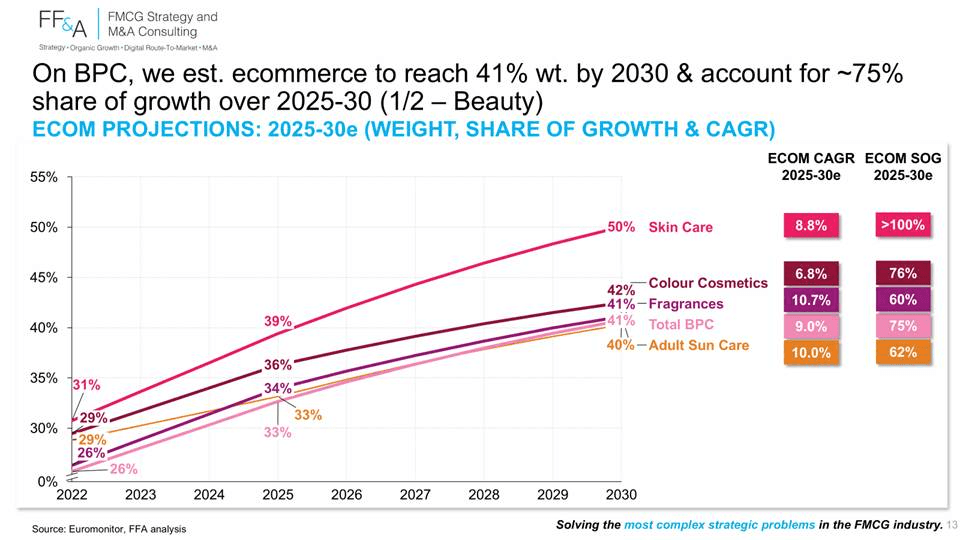
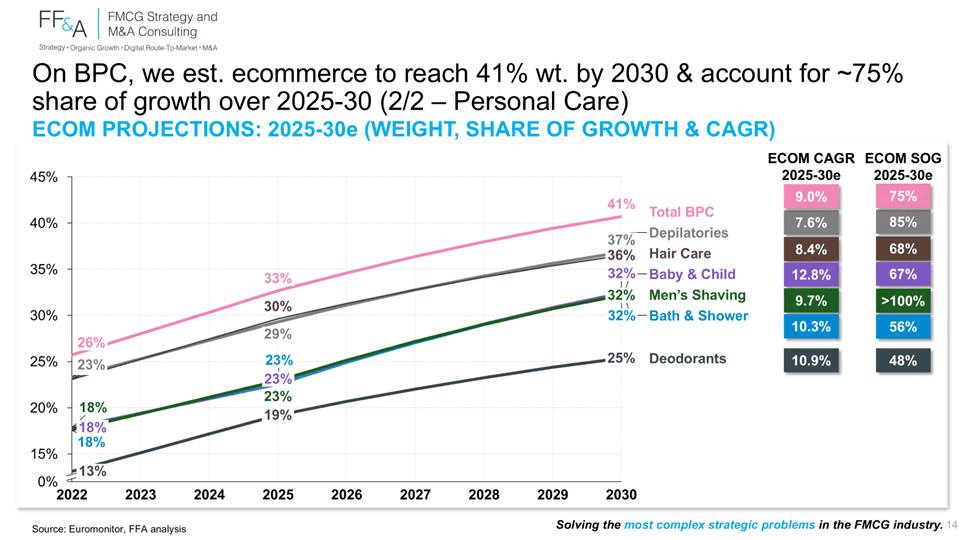
2) Beauty & Personal Care — A $534Bn category where online is already the growth engine (33% weight, 75% share of growth)
3) The Verdict — All Top 10 BPC Companies Are Under-Trading Online With Large Difference in Performance
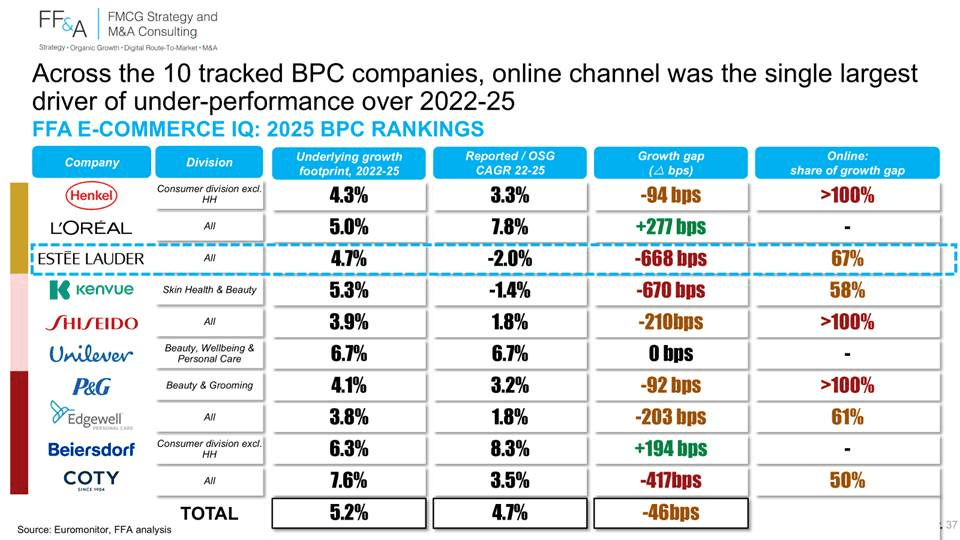
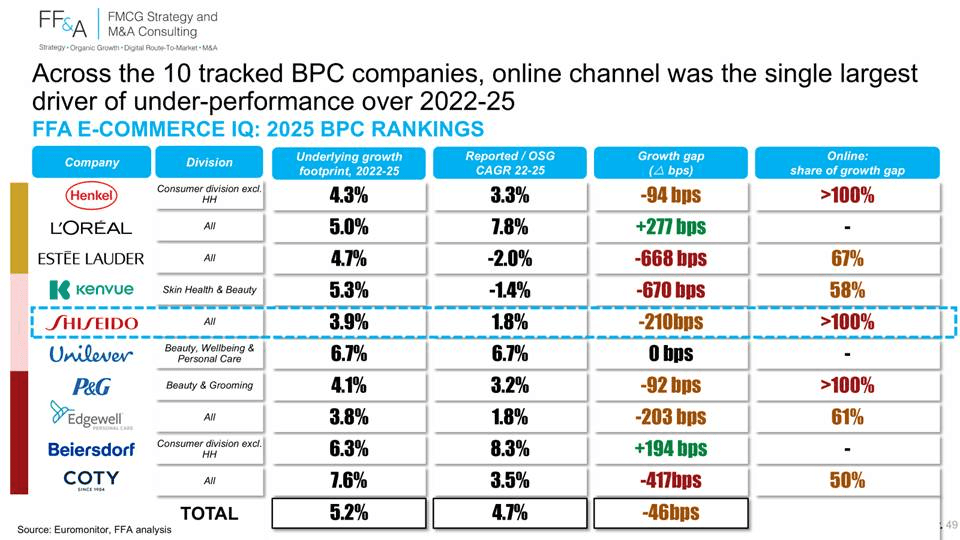
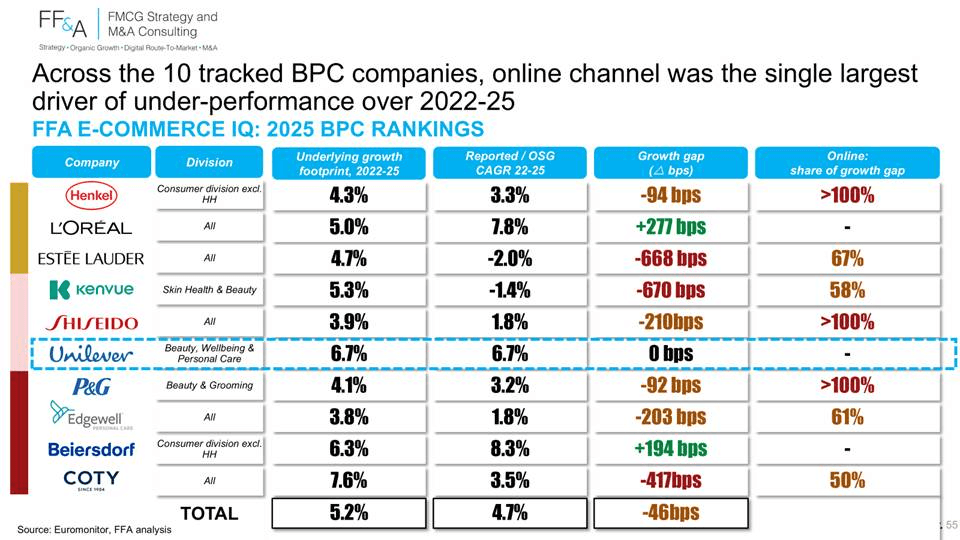
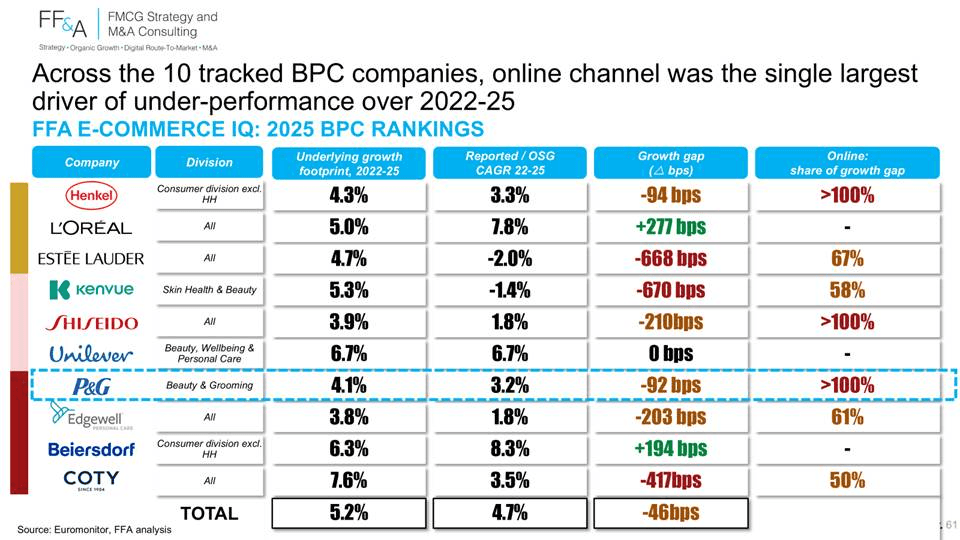
4) Online Is The #1 Driver of Growth Under-Performance for BPC Companies
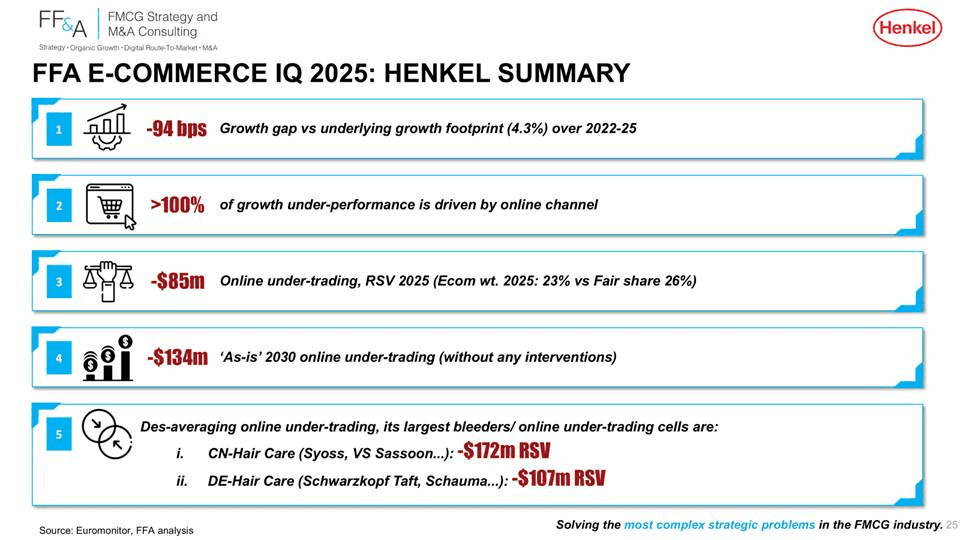
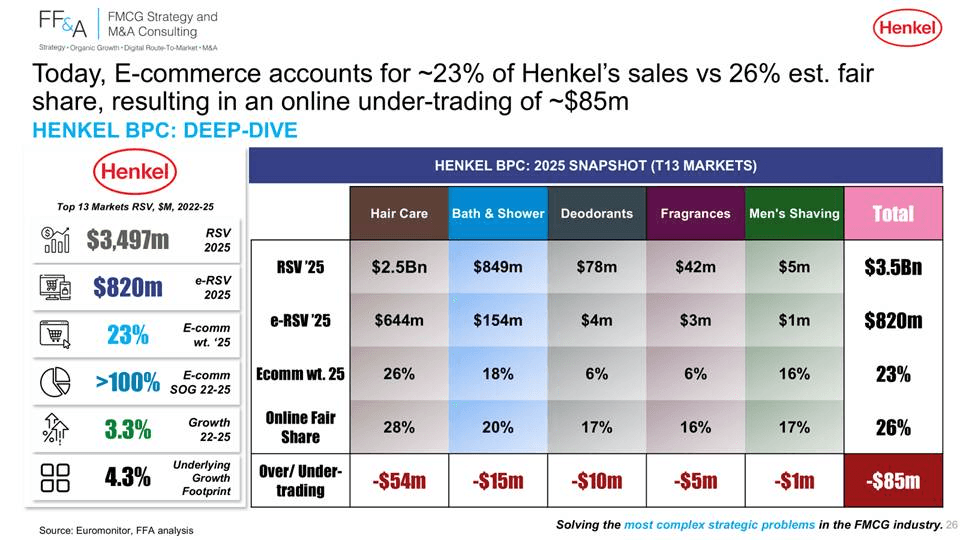
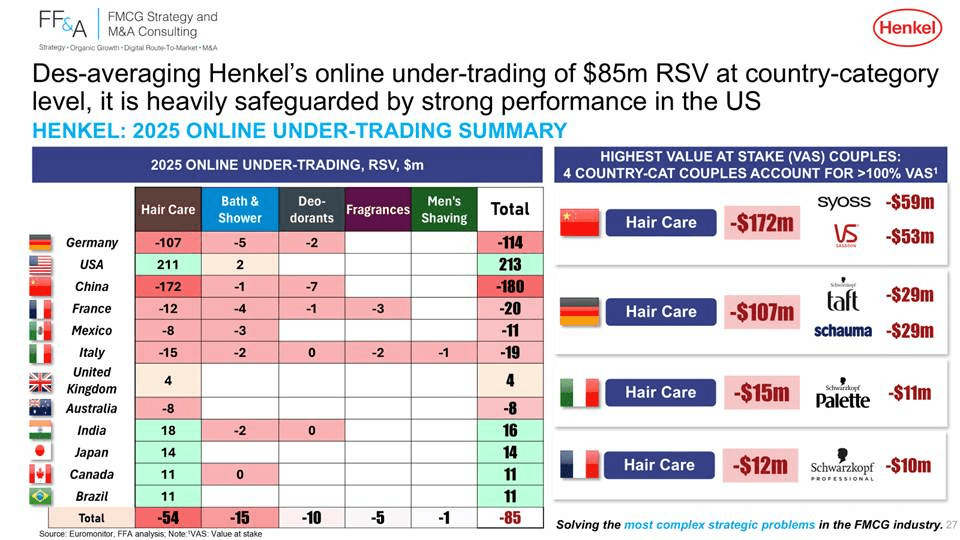
5) Henkel (Ix 92) — Close Owing To Its Professional Hair Brands In US, But Still Short on Ecom Fair Share


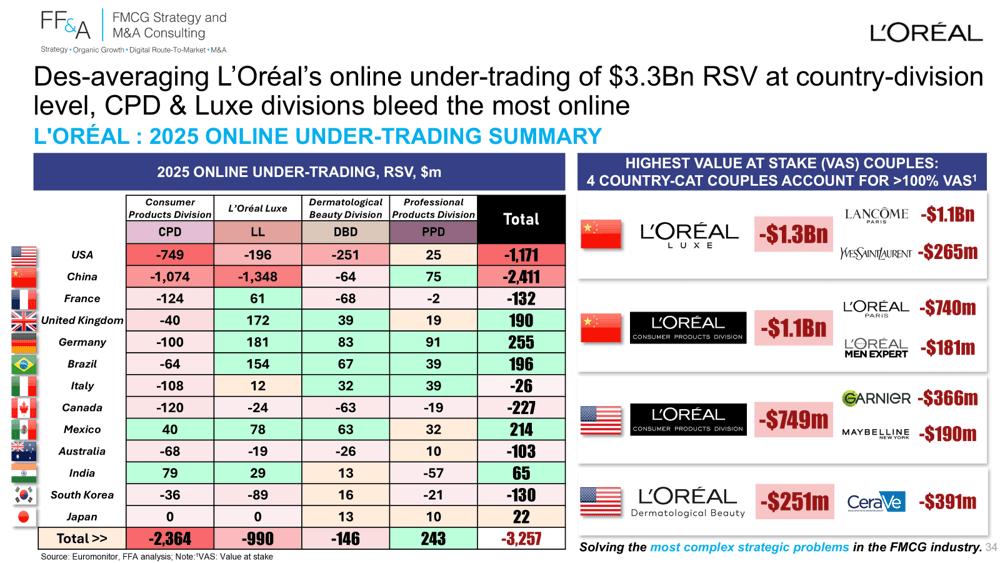
6) L’Oréal (Ix 82) — 2nd Best Ecom Index (-$3.3Bn)
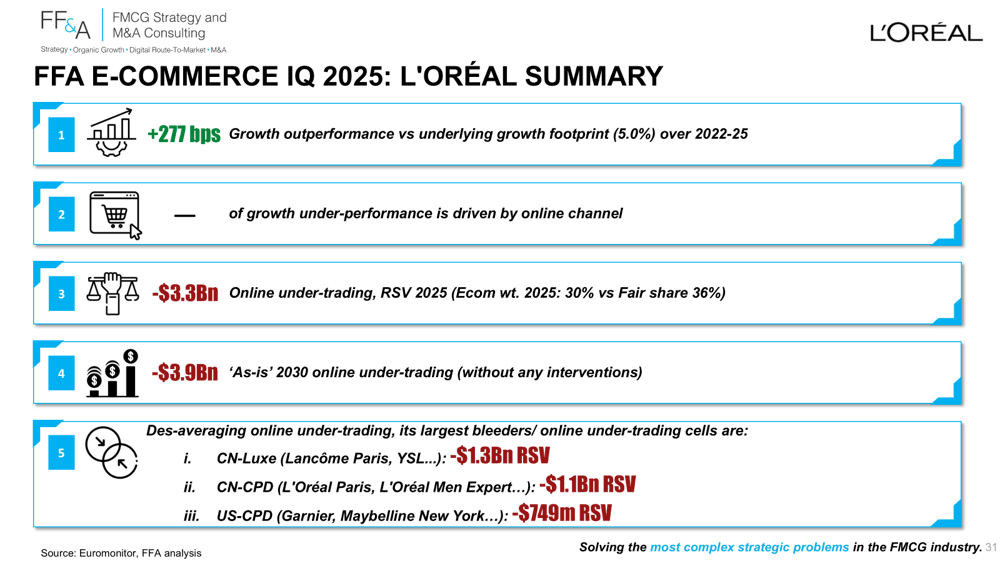
• One of the very few outperforming its underlying footprint (7.8% growth vs. 5.0% footprint, +277 bps)

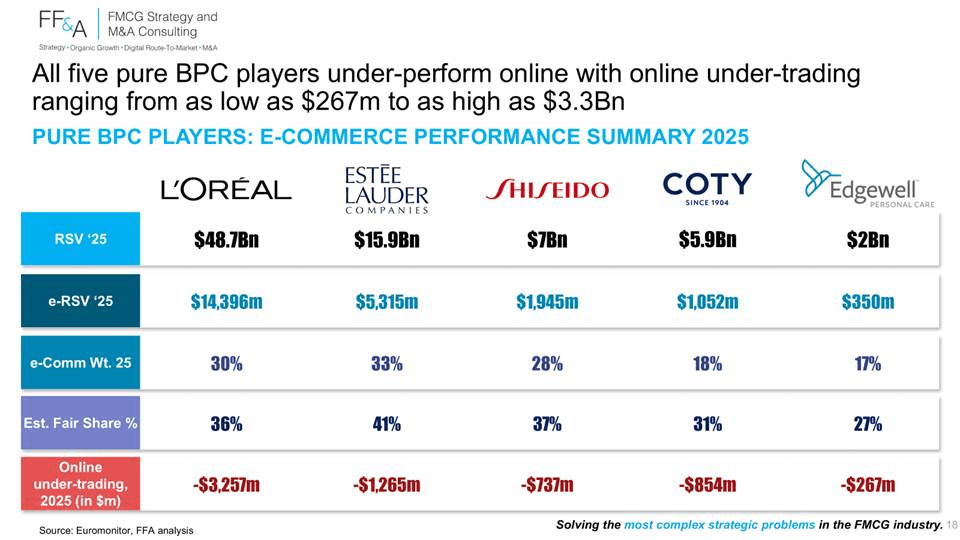
• 30% E-comm weight vs. 36% fair share → online costing L’Oréal -$3.3Bn RSV today, widening to -$3.9Bn by 2030e
• CPD (-$2.4Bn) & Luxe (-$1.0Bn) divisions account for the entirety of the bleed — PPD is the only division over-trading online
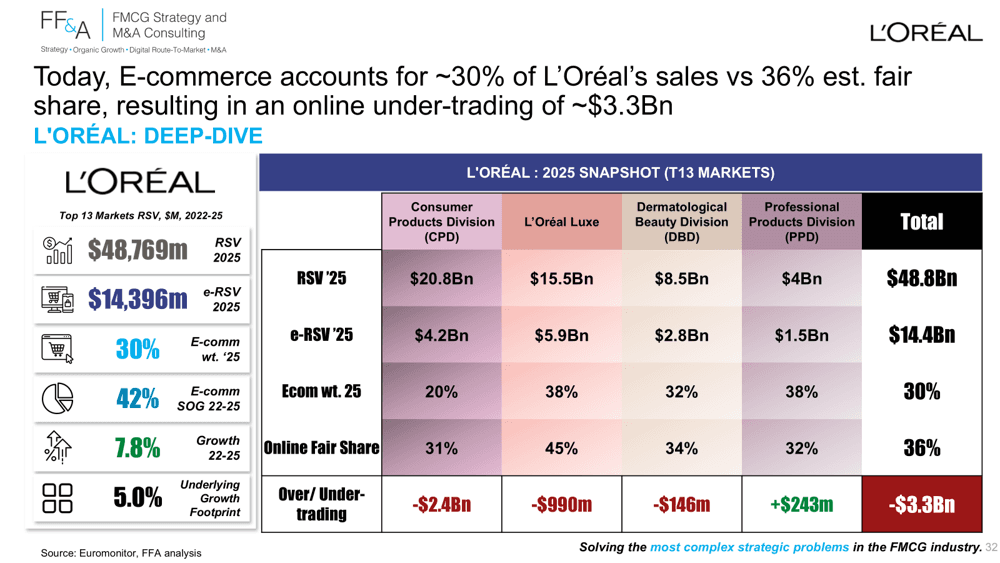
• In the absence of ecom wt. des-averaged by category × price tier, under-trading is likely over-stated for CPD & under-stated for other divisions
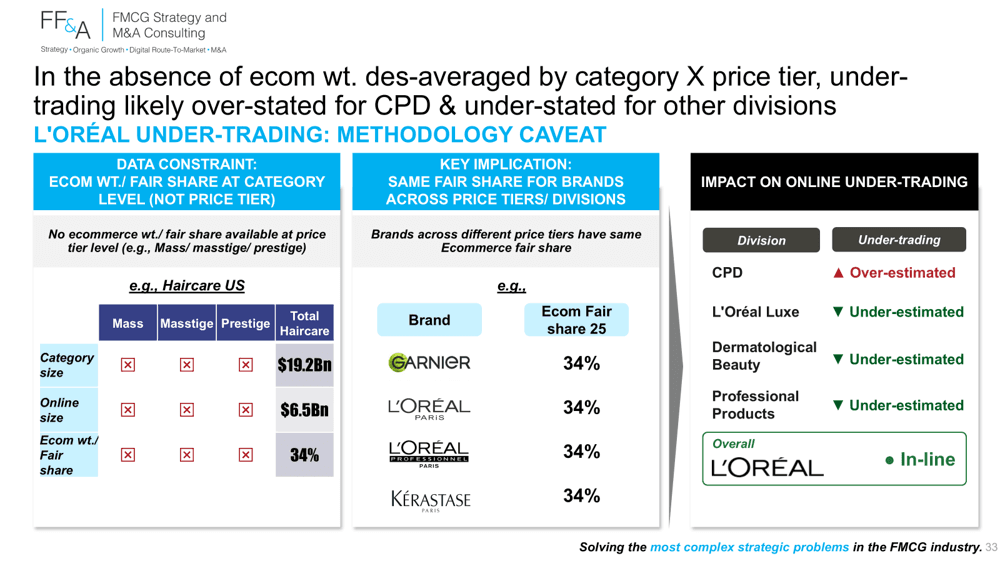
• Three country-category couples account for >100% of value at stake:
v China - Luxe (Lancôme Paris, YSL): -$1.3Bn
v China - CPD (L’Oréal Paris, L’Oréal Men Expert): -$1.1Bn
v US - CPD (Garnier, Maybelline New York): -$749m
7) Estée Lauder (Ix 81) — Highest Online Weight (33%) Yet One Of The Widest Online Bleeds
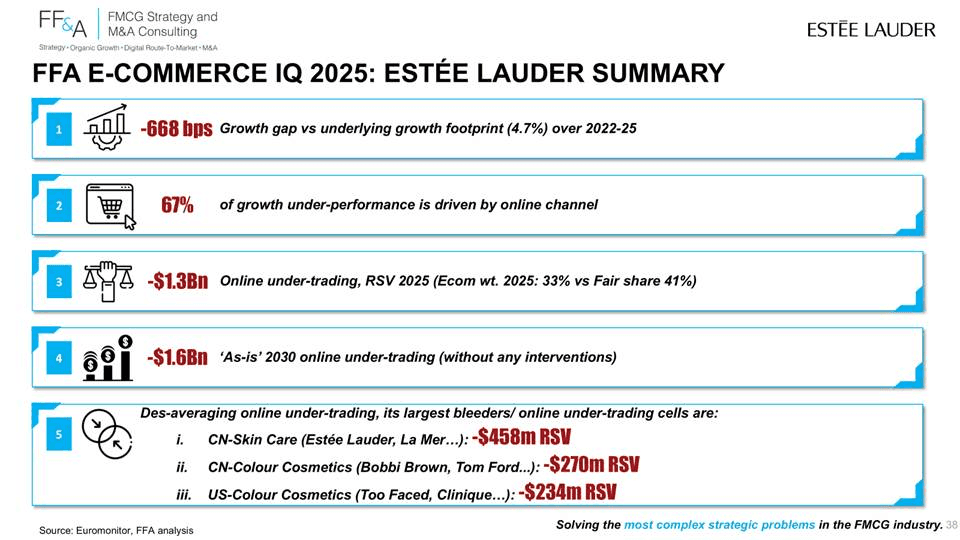
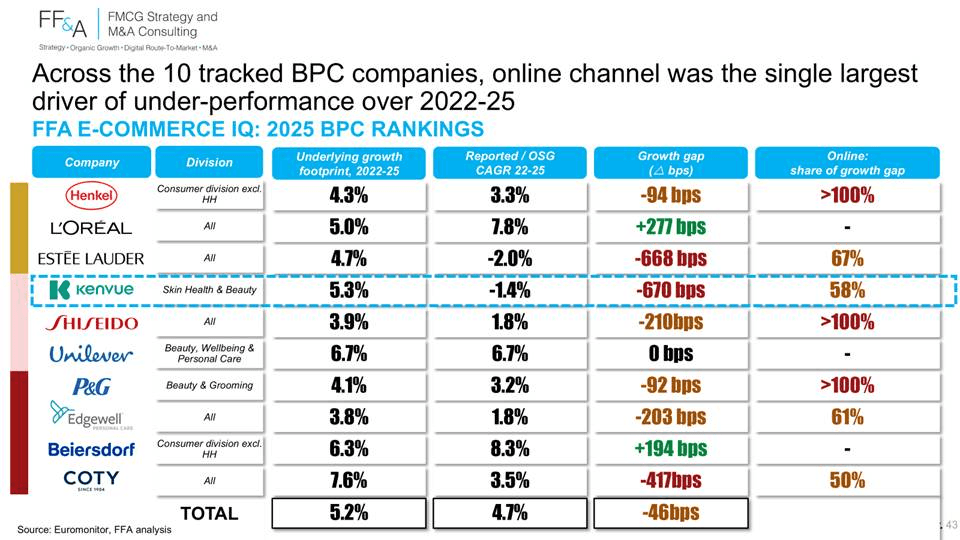
• The deceptive 33% online weight that hides a 41% fair share & >67% of the growth gap (gap: -668 bps)
• One of the worst performers vs. its footprint (-2.0% vs. 4.7% footprint)
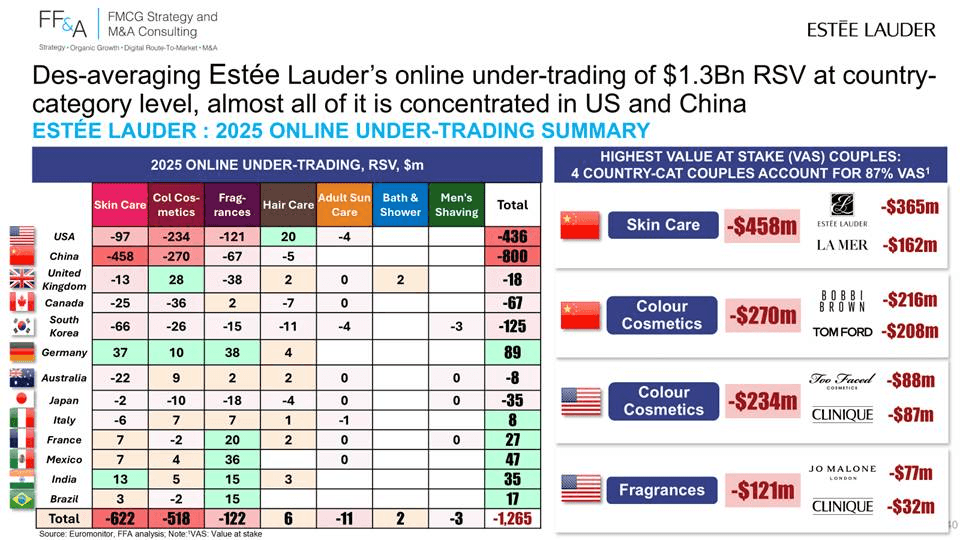
• 33% E-comm weight vs. 41% fair share → online costing Estée Lauder -$1.3Bn RSV today, widening to -$1.6Bn by 2030e
• ~90% of the bleed in Skin Care & Colour Cosmetics — with the US (-$436m) & China (-$800m) carrying almost all of it
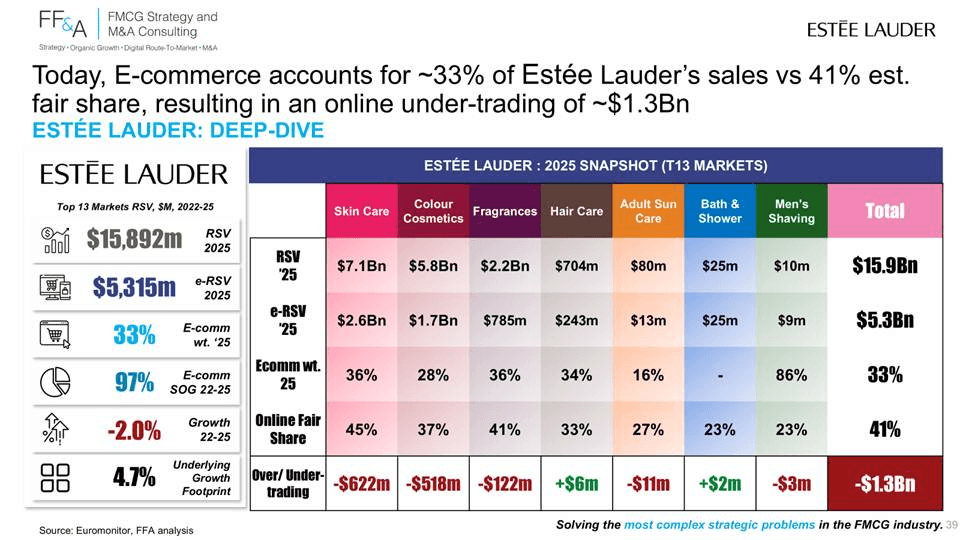
• Three country-category couples account for ~87% of VAS:
v China - Skin Care (Estée Lauder, La Mer): -$458m
v China - Colour Cosmetics (Bobbi Brown, Tom Ford): -$270m
v US - Colour Cosmetics (Too Faced, Clinique): -$234m
8) Kenvue (Ix 76) — Attractive Footprint, Yet A Painful Online Bleed
• A CHC player navigating a BPC-paced online fight — with a wide growth gap of -670 bps despite a 5.3% category footprint

• 58% of the growth gap is online-driven (CAGR -1.4% vs. 5.3% footprint)
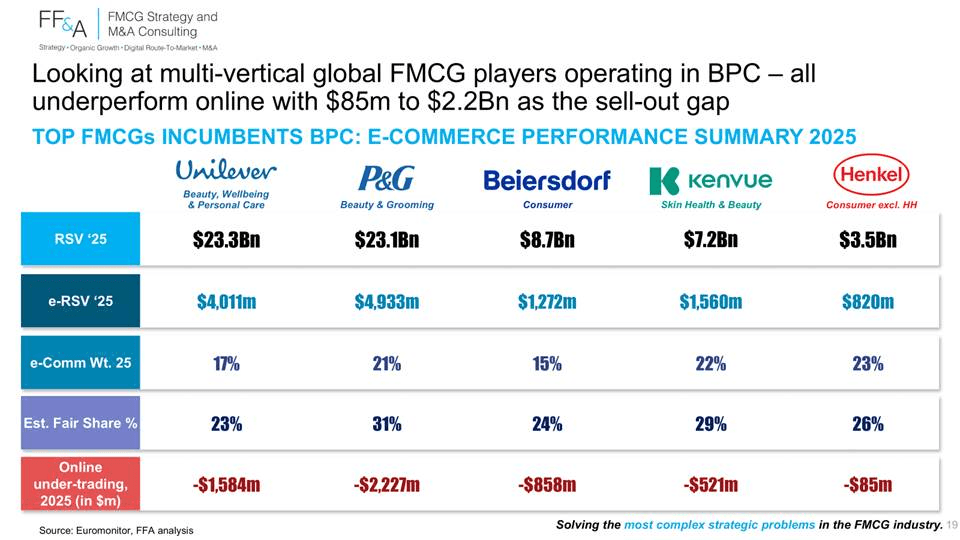
• 22% E-comm weight vs. 29% fair share → online costing Kenvue -$521m RSV today, widening to -$690m by 2030e
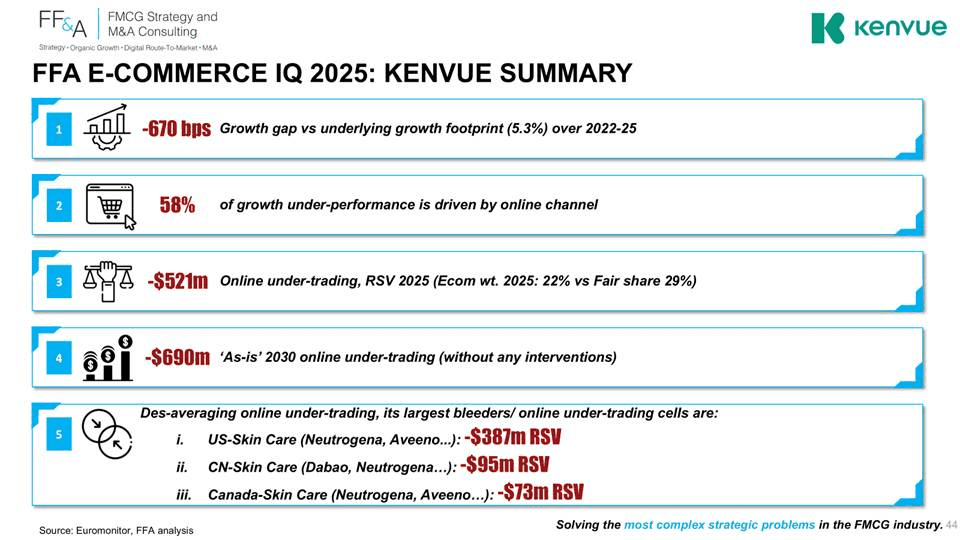
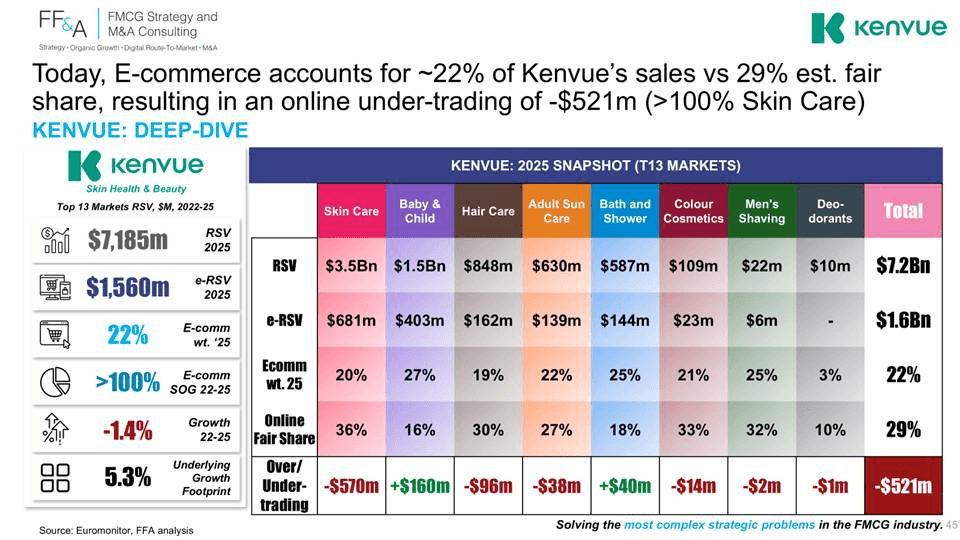
• >100% of the net bleed sits in Skin Care (Neutrogena, Aveeno…) — the very categories that should be Kenvue’s online stronghold
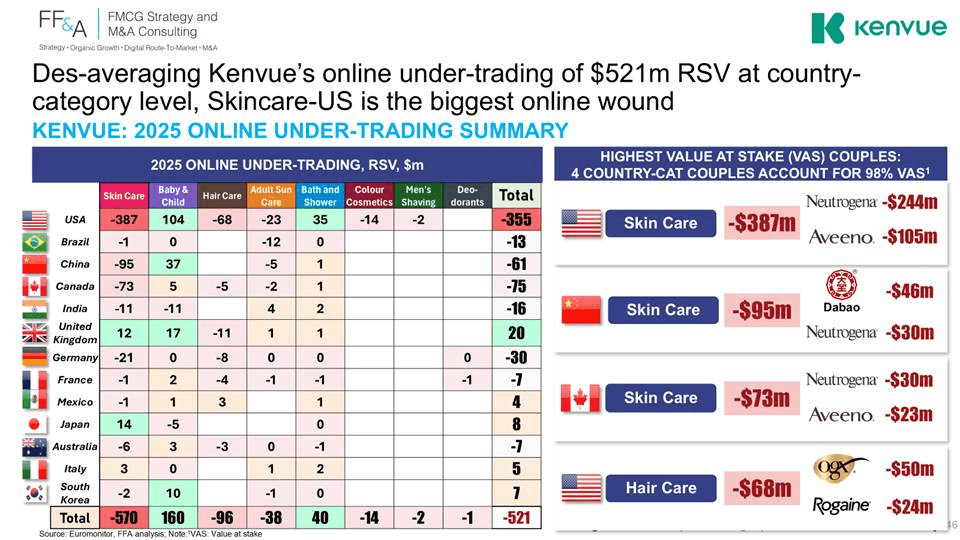
• Three country-category couples account for ~98% of VAS:
v US - Skin Care (Neutrogena, Aveeno): -$387m
v China - Skin Care (Dabao, Neutrogena): -$95m
v Canada - Skin Care (Neutrogena, Aveeno): -$73m
9) Shiseido (Ix 75) — Skincare Sensei, Online Novice
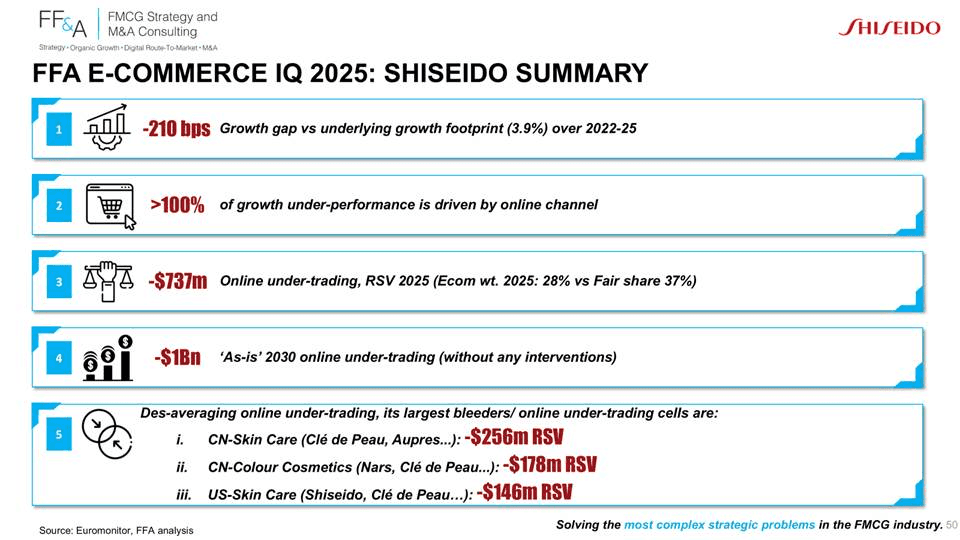
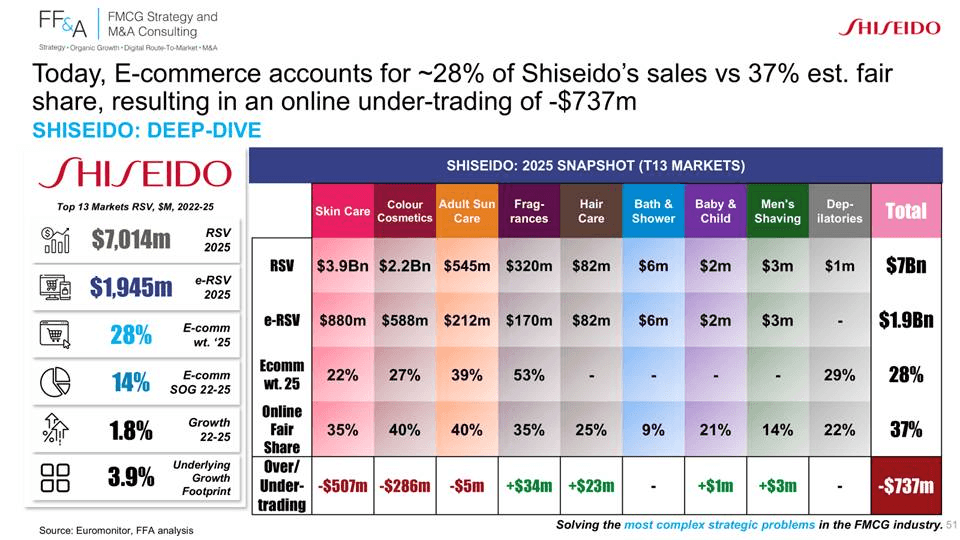
• An under-performer at 28% E-comm weight vs. 37% fair share → online costing Shiseido -$737m RSV today, widening to -$1.0Bn by 2030e
• 100% of Shiseido’s growth gap is online-driven (gap: -210 bps over 2022–25)
• ~70% of the bleed in Skin Care, the remainder in Colour Cosmetics
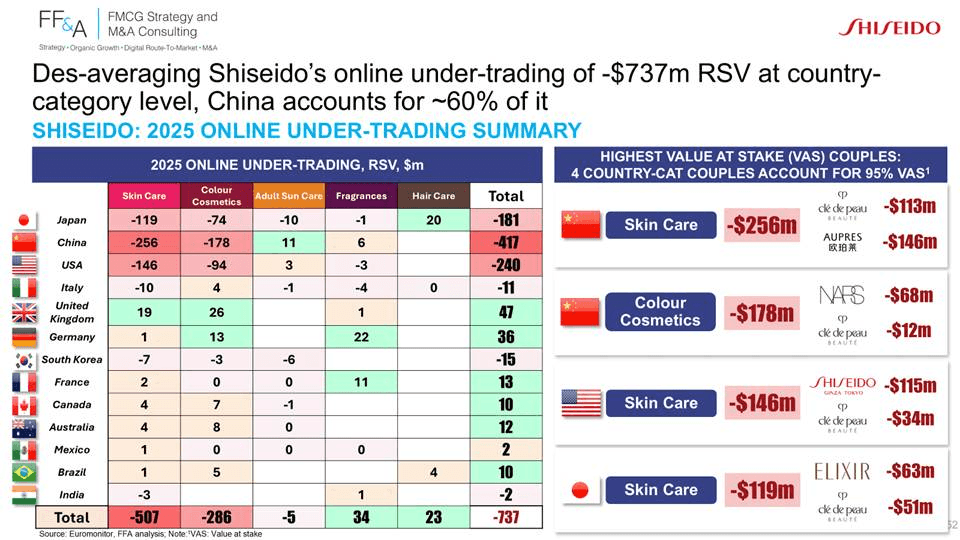
• China alone drives ~$417m / ~60% of the total online bleed
• Three country-category couples account for ~95% of VAS:
v China - Skin Care (Clé de Peau, Aupres): -$256m
v China - Colour Cosmetics (Nars, Clé de Peau): -$178m
v US - Skin Care (Shiseido, Clé de Peau): -$146m
10) Unilever (Ix 74) — Broad Portfolio, Even Broader Online Gap
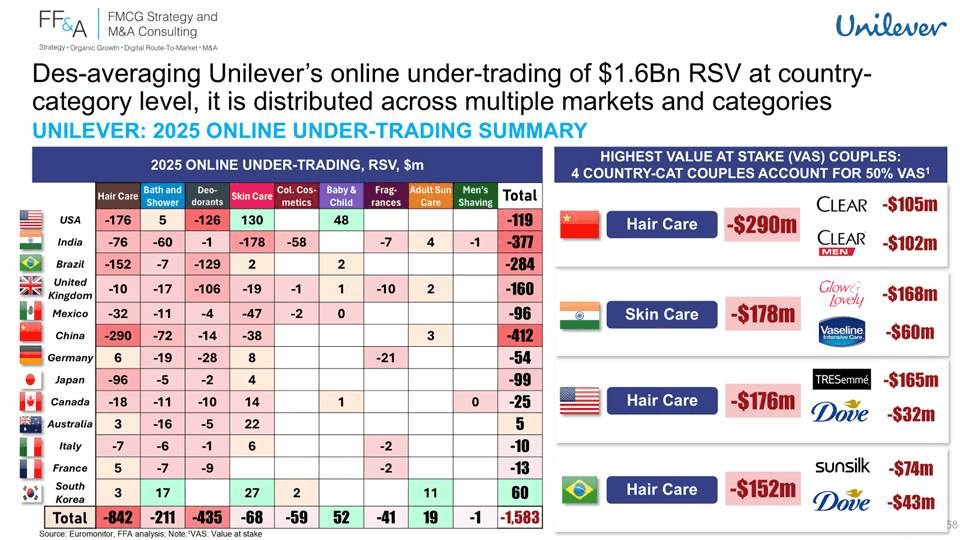
• The 3rd-largest & most spread-out online bleed of the cohort (-$1.6Bn)
• Growth in-line with its footprint (6.7% vs. 6.7%) — yet a deep online gap nonetheless
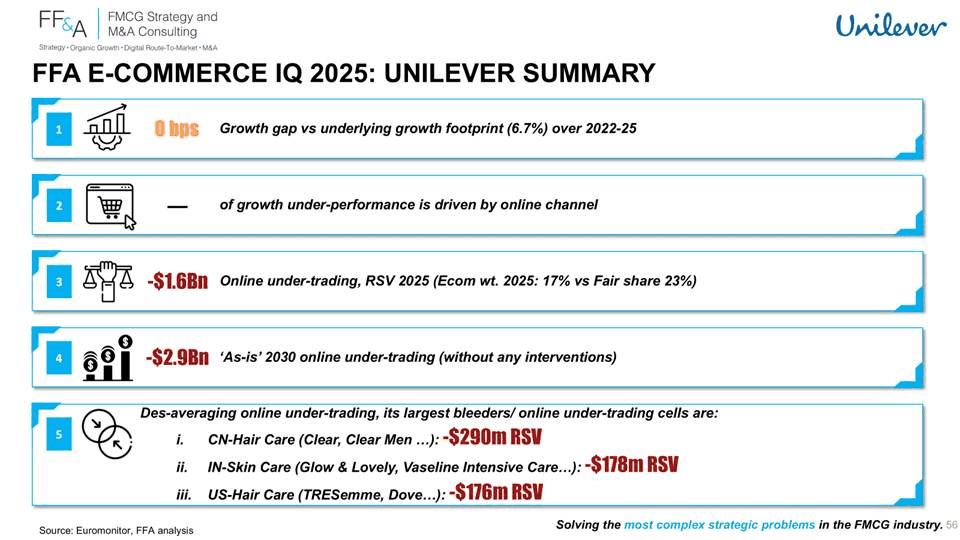
• 17% E-comm weight vs. 23% fair share → online costing Unilever -$1.6Bn RSV today, widening to -$2.9Bn by 2030e — the steepest ‘as-is’ increase of all 10 if no interventions
• Hair Care (-$842m) & Deodorants (-$435m) drive ~80% of the bleed — distributed across multiple markets & categories
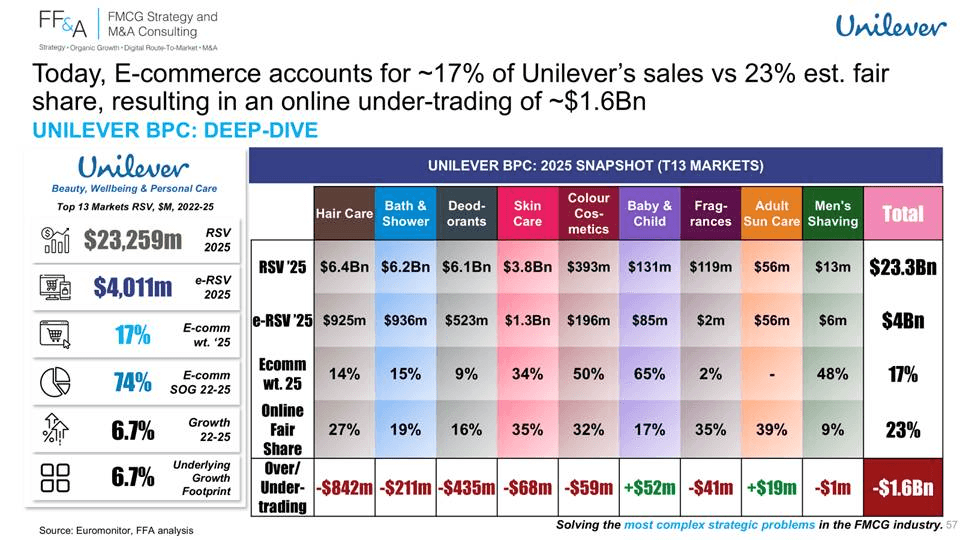
• Three country-category couples account for ~50% of VAS:
v China - Hair Care (Clear, Clear Men): -$290m
v India - Skin Care (Glow & Lovely, Vaseline Intensive Care): -$178m
v US - Hair Care (TRESemmé, Dove): -$176m
11) P&G Beauty & Grooming (Ix 69) — A Growth Gap All Driven By Online
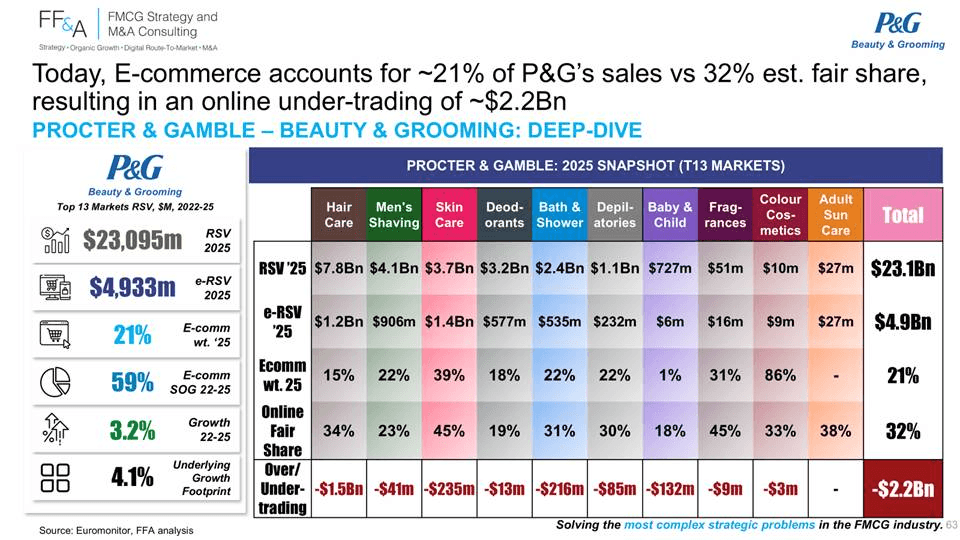
• >100% of P&G’s growth gap is online-driven (gap: -92 bps over 2022–25)
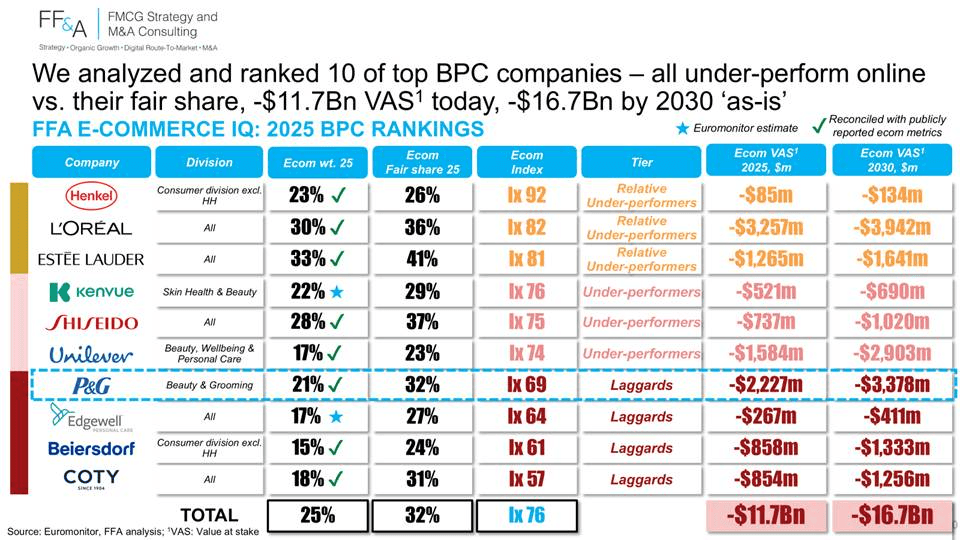
• 21% E-comm weight vs. 32% fair share → online costing P&G Beauty & Grooming -$2.2Bn RSV today, widening to -$3.4Bn by 2030e
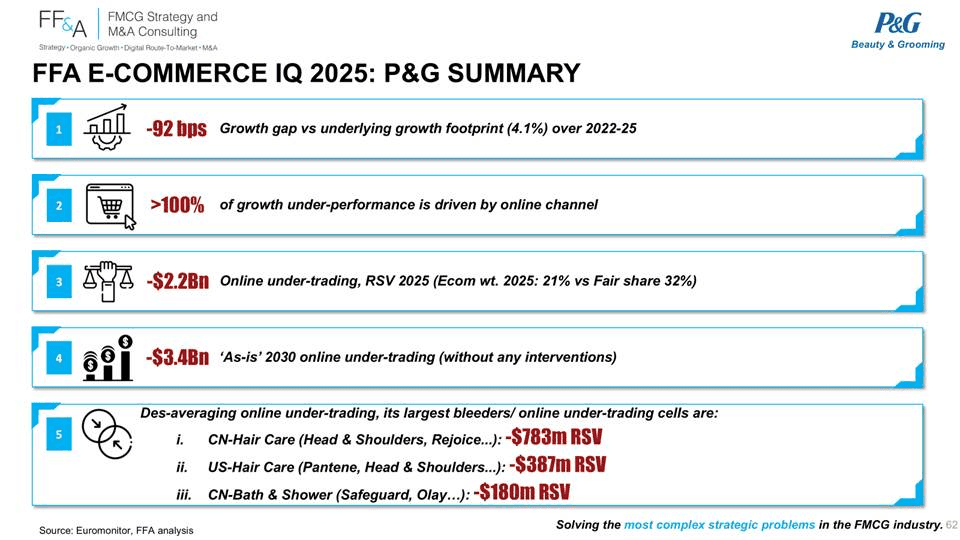
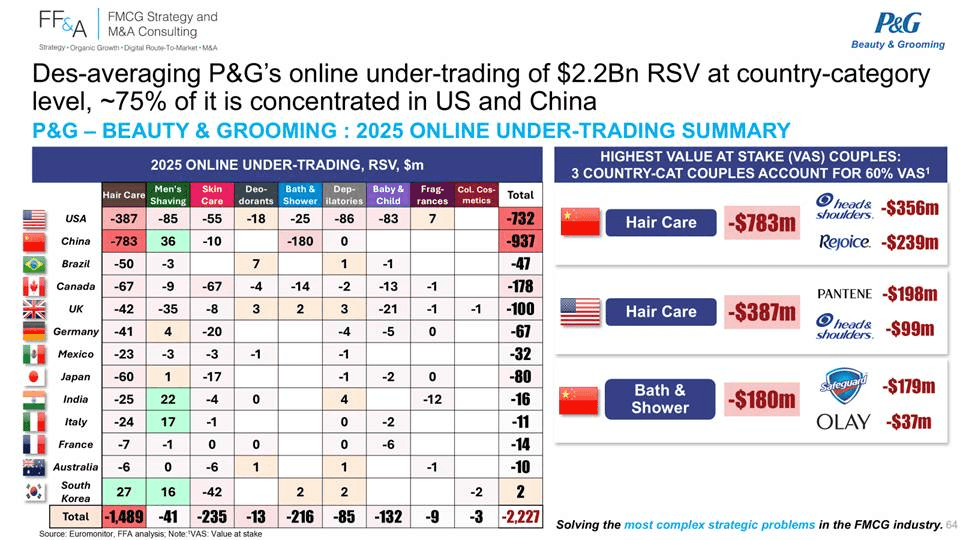
• ~67% of the bleed in Hair Care (Pantene, Head & Shoulders…) — with ~75% of total VAS concentrated in the US (-$732m) & China (-$937m)
• Three country-category couples account for ~60% of VAS:
v China - Hair Care (Head & Shoulders, Rejoice): -$783m
v US - Hair Care (Pantene, Head & Shoulders): -$387m
v China - Bath & Shower (Safeguard, Olay): -$180m
12) Edgewell Personal Care (Ix 64) — A Razor-Thin Online Presence Making It An Online Laggard
• 61% of Edgewell’s growth gap is online-driven (gap: -203 bps over 2022–25)
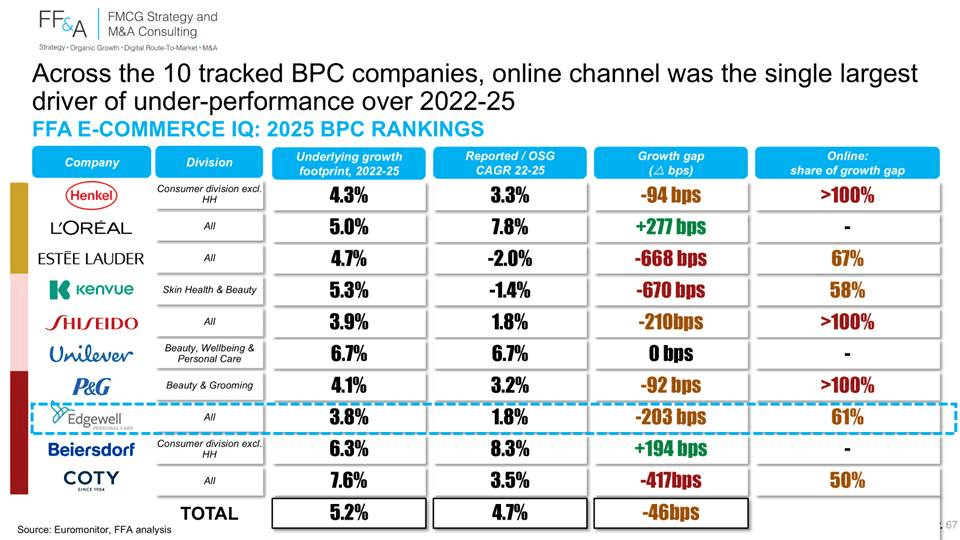
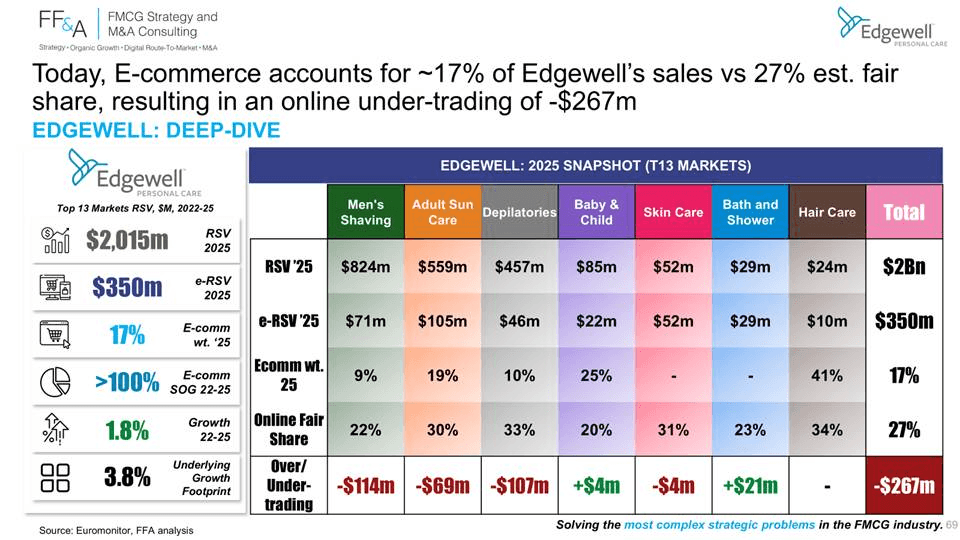
• 17% E-comm weight vs. 27% fair share → online costing Edgewell -$267m RSV today, widening to -$411m by 2030e
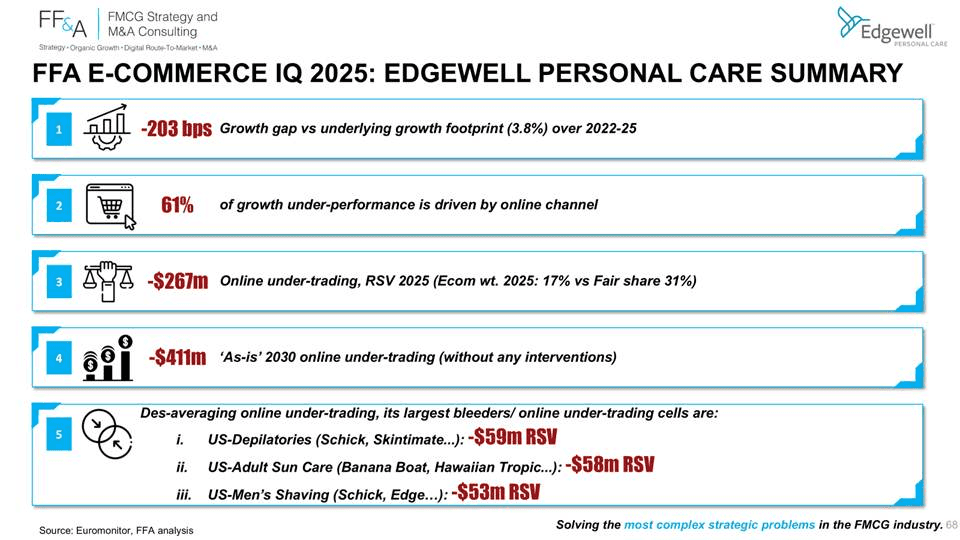
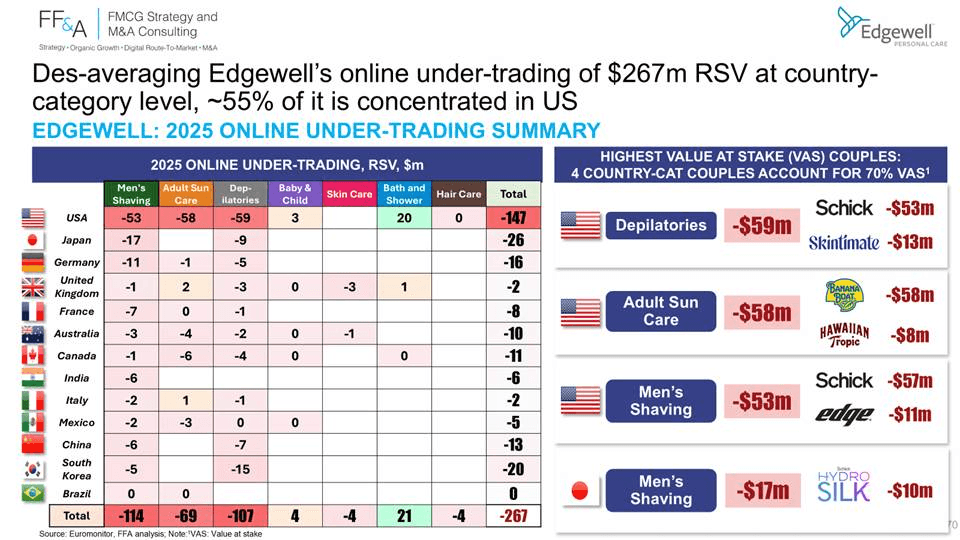
• ~55% of the bleed concentrated in the US (-$147m) — spread almost evenly across Men’s Shaving, Adult Sun Care & Depilatories
• Three country-category couples account for ~70% of VAS:
v US - Depilatories (Schick, Skintimate): -$59m
v US - Adult Sun Care (Banana Boat, Hawaiian Tropic): -$58m
v US - Men’s Shaving (Schick, Edge): -$53m
13) Beiersdorf (Ix 61) — The Blue-Tinned Online Laggard
• +194 bps strong outperformance (8.3% vs. 6.3% footprint) over 2022–25 — yet an online laggard (Ix 61)

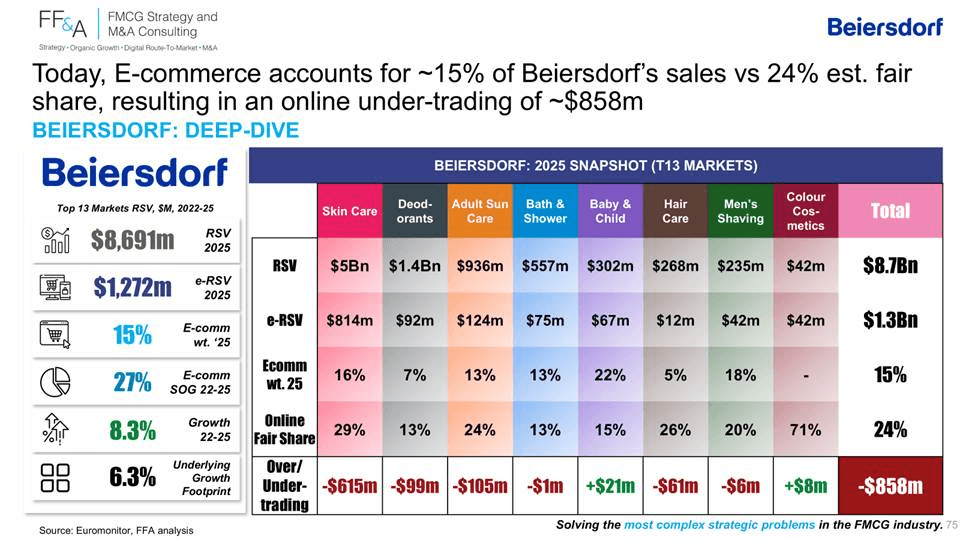
• 15% E-comm weight vs. 24% fair share → online costing Beiersdorf -$858m RSV today, widening to -$1.3Bn by 2030e
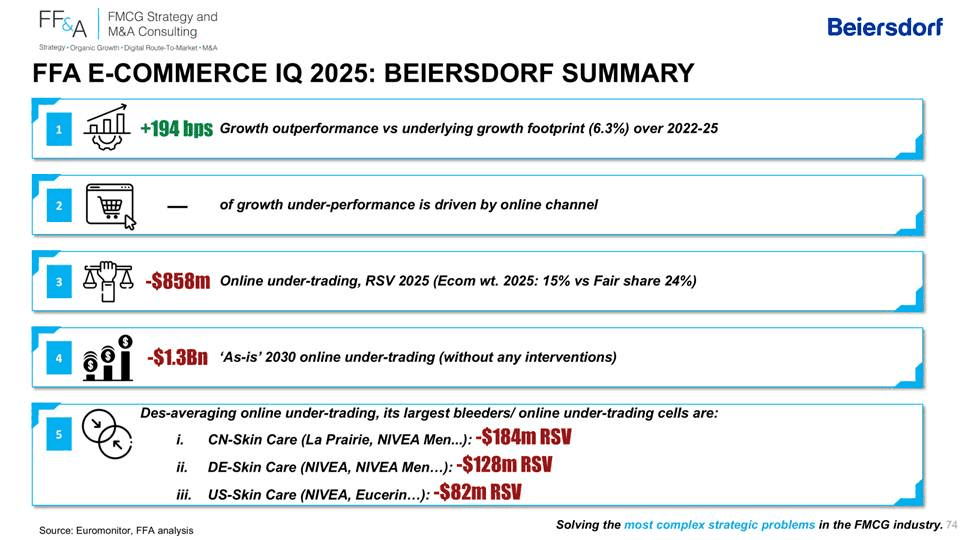
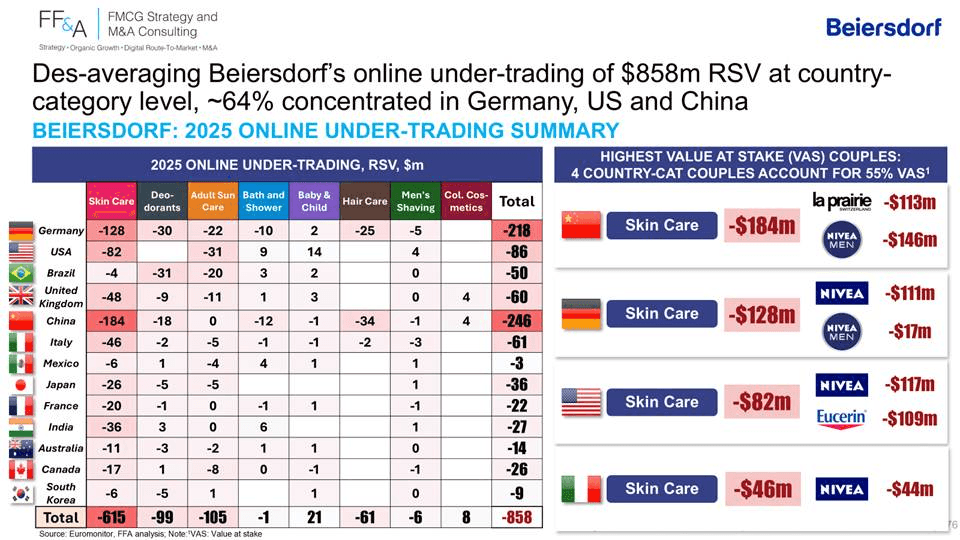
• ~72% of the bleed in Skin Care (NIVEA, Eucerin, La Prairie…) — with ~64% concentrated in Germany (-$218m), China (-$246m) & the US (-$86m)
• Three country-category couples account for ~55% of VAS:
v China - Skin Care (La Prairie, NIVEA Men): -$184m
v Germany - Skin Care (NIVEA, NIVEA Men): -$128m
v US - Skin Care (NIVEA, Eucerin): -$82m
14) Coty (Ix 57) — Slipping In Store, Sliding Online
• The lowest index score among all 10 tracked (Ix 57) — & a wide growth gap at -417 bps (CAGR 3.5% vs. 7.6% footprint)
• 50% of the growth gap is online-driven
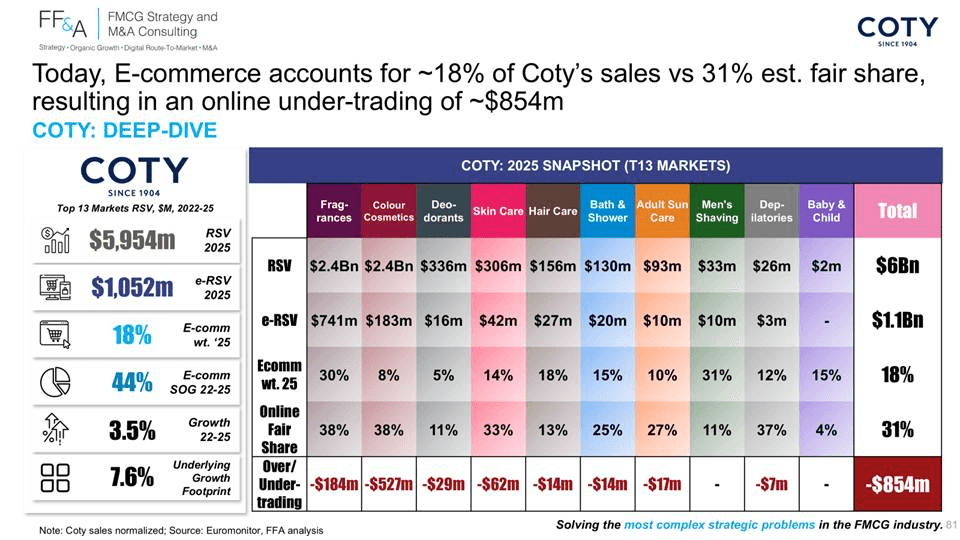
• 18% E-comm weight vs. 31% fair share → online costing Coty -$854m RSV today, widening to -$1.3Bn by 2030e
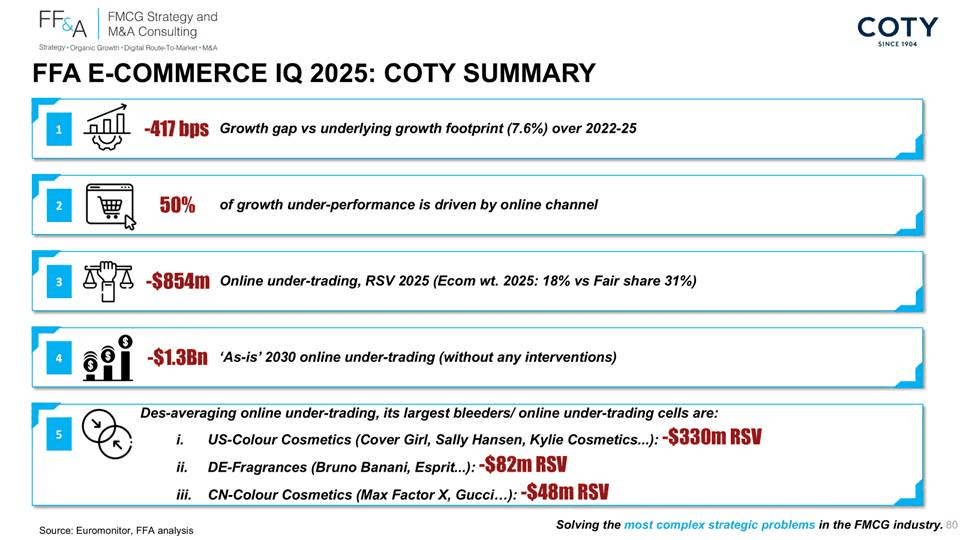
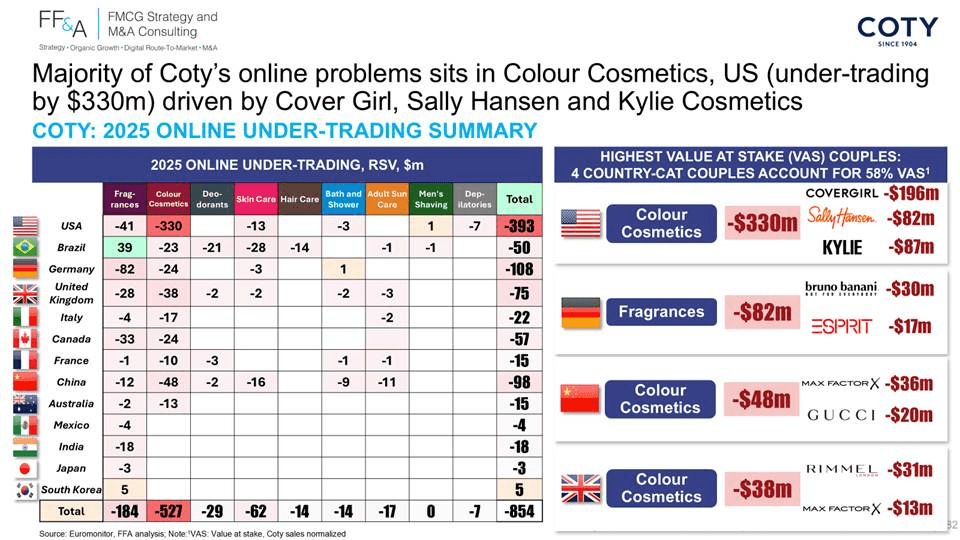
• ~62% of the bleed in Colour Cosmetics — with US-Colour Cosmetics alone the single biggest online wound (-$330m)
• Three country-category couples account for ~58% of VAS:
v US - Colour Cosmetics (Cover Girl, Sally Hansen, Kylie Cosmetics): -$330m
v Germany - Fragrances (Bruno Banani, Esprit): -$82m
v China - Colour Cosmetics (Max Factor, Gucci): -$48m
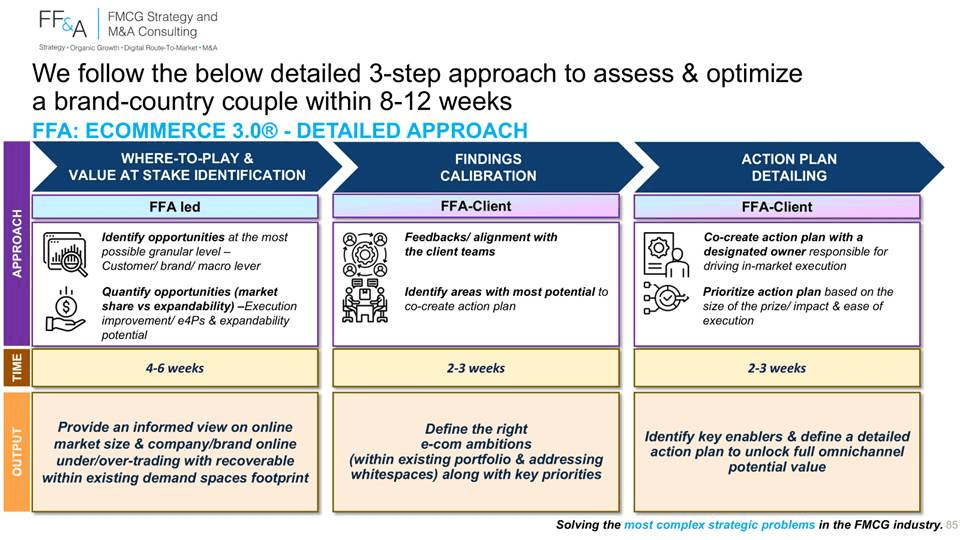
15) Introducing FF&A E-commerce 3.0® — the replicable approach to Ecommerce acceleration delivering between 20% and 60% ecommerce revenue uplift, tested & proven across 50+ brands/ countries cells for the world largest FMCG companies
16) Bringing it all together
The last decade in BPC e-commerce was about building foundations & playing catch-up on online weight.
It was also the decade that rewrote the category: online-native challengers scaled from nothing to hundreds of millions-dollar brands almost entirely on the digital shelf, social & live commerce. TikTok Shop, Douyin & Instagram turned discovery into instant conversion, & retail consolidation — from Amazon & Tmall to Sephora & a handful of omnichannel gatekeepers — reshaped who controls access to the shopper.
The top 10 BPC players invested heavily through all of it — yet every single one still under-trades online, for a combined $11.7Bn bleed today widening 'as-is' to $16.7Bn by 2030.
The next 5 years will be about bringing high-ROI incremental omnichannel value — diagnosing the gap at country-brand level, pricing it in $m, & prescribing the recovery path on all 6 drivers of online performance, now AI-enabled.
If your company is among the above list — we are happy to walk you through our research, your specific Value at Stake at country-brand level, our Ecommerce 3.0® approach & our case studies
Exciting & decisive times.
Get in touch:
To follow Frederic, please click Here. To start a conversation, email at: frederic@fredericfernandezassociates.com
To get the full deck of this publication, please write us at contact@fredericfernandezassociates.com
To subscribe to our newsletter and receive all our CEOs Insights, sign-up at the following link: FMCG CEOs: FMCG CEOs: Managing For Growth
About FF&A:
FF&A solves the most complex strategic problems of the world's largest FMCG companies across:
- Corporate Strategy
- Organic Growth (cf. our proprietary Zero-Based-Growth® - https://lnkd.in/eWQEmcK3)
- Small Brands Growth (cf. our proprietary How Small Brands Grow® - https://lnkd.in/eyp3Baq5)
- Digital RTM / Ecommerce (cf. our proprietary Ecommerce 2.0® - https://lnkd.in/e4-Q69Fi)
- M&A (cf. our proprietary Best Acquirers® approach in FMCG - https://lnkd.in/gK7yj8Gm)
14 out of the top 20 world's largest FMCG companies are repeat Clients.
FF&A team intervenes all across the globe and across all FMCG categories. To know more, please visit our websites: www.fredericfernandezassociates.com | www.exponentialfmcg.com
No FF&A employees own any financial instruments on any FMCG companies or companies mentioned in the above publication
Enjoyed this article?

FMCG CEOs: Managing For Growth
Strategic insights for FMCG/ CPG CEOs